从https://elasticsearch.cn/download/下载
ElasticSearch Linux64(DEB)
Kibana Linux64(DEB)
Logstash Linux64(DEB)
su root
1. cd /etc/elasticsearch/
2. vim elasticsearch.yml
root@lzh-virtual-machine:/etc/elasticsearch# cat elasticsearch.yml
# ======================== Elasticsearch Configuration =========================
#
# NOTE: Elasticsearch comes with reasonable defaults for most settings.
# Before you set out to tweak and tune the configuration, make sure you
# understand what are you trying to accomplish and the consequences.
#
# The primary way of configuring a node is via this file. This template lists
# the most important settings you may want to configure for a production cluster.
#
# Please consult the documentation for further information on configuration options:
# https://www.elastic.co/guide/en/elasticsearch/reference/index.html
#
# ---------------------------------- Cluster -----------------------------------
#
# Use a descriptive name for your cluster:
#
#cluster.name: my-application
#
# ------------------------------------ Node ------------------------------------
#
# Use a descriptive name for the node:
#
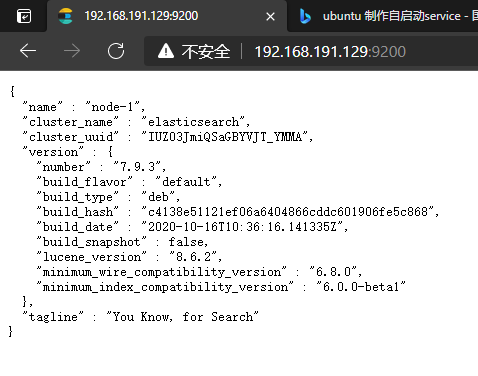
node.name: node-1
#
# Add custom attributes to the node:
#
#node.attr.rack: r1
#
# ----------------------------------- Paths ------------------------------------
#
# Path to directory where to store the data (separate multiple locations by comma):
#
path.data: /var/lib/elasticsearch
#
# Path to log files:
#
path.logs: /var/log/elasticsearch
#
# ----------------------------------- Memory -----------------------------------
#
# Lock the memory on startup:
#
#bootstrap.memory_lock: true
#
# Make sure that the heap size is set to about half the memory available
# on the system and that the owner of the process is allowed to use this
# limit.
#
# Elasticsearch performs poorly when the system is swapping the memory.
#
# ---------------------------------- Network -----------------------------------
#
# Set the bind address to a specific IP (IPv4 or IPv6):
#
network.host: 0.0.0.0
#
# Set a custom port for HTTP:
#
http.port: 9200
#
# For more information, consult the network module documentation.
#
# --------------------------------- Discovery ----------------------------------
#
# Pass an initial list of hosts to perform discovery when this node is started:
# The default list of hosts is ["127.0.0.1", "[::1]"]
#
#discovery.seed_hosts: ["host1", "host2"]
#
# Bootstrap the cluster using an initial set of master-eligible nodes:
#
cluster.initial_master_nodes: ["node-1"]
#
# For more information, consult the discovery and cluster formation module documentation.
#
# ---------------------------------- Gateway -----------------------------------
#
# Block initial recovery after a full cluster restart until N nodes are started:
#
#gateway.recover_after_nodes: 3
#
# For more information, consult the gateway module documentation.
#
# ---------------------------------- Various -----------------------------------
#
# Require explicit names when deleting indices:
#
#action.destructive_requires_name: true
root@lzh-virtual-machine:/etc/elasticsearch# cat jvm.options
## JVM configuration################################################################
## IMPORTANT: JVM heap size
################################################################
##
## You should always set the min and max JVM heap
## size to the same value. For example, to set
## the heap to 4 GB, set:
##
## -Xms4g
## -Xmx4g
##
## See https://www.elastic.co/guide/en/elasticsearch/reference/current/heap-size.html
## for more information
##
################################################################# Xms represents the initial size of total heap space
# Xmx represents the maximum size of total heap space-Xms2g
-Xmx2g################################################################
## Expert settings
################################################################
##
## All settings below this section are considered
## expert settings. Don't tamper with them unless
## you understand what you are doing
##
################################################################## GC configuration
8-13:-XX:+UseConcMarkSweepGC
8-13:-XX:CMSInitiatingOccupancyFraction=75
8-13:-XX:+UseCMSInitiatingOccupancyOnly## G1GC Configuration
# NOTE: G1 GC is only supported on JDK version 10 or later
# to use G1GC, uncomment the next two lines and update the version on the
# following three lines to your version of the JDK
# 10-13:-XX:-UseConcMarkSweepGC
# 10-13:-XX:-UseCMSInitiatingOccupancyOnly
14-:-XX:+UseG1GC
14-:-XX:G1ReservePercent=25
14-:-XX:InitiatingHeapOccupancyPercent=30## JVM temporary directory
-Djava.io.tmpdir=${ES_TMPDIR}## heap dumps# generate a heap dump when an allocation from the Java heap fails
# heap dumps are created in the working directory of the JVM
-XX:+HeapDumpOnOutOfMemoryError# specify an alternative path for heap dumps; ensure the directory exists and
# has sufficient space
-XX:HeapDumpPath=/var/lib/elasticsearch# specify an alternative path for JVM fatal error logs
-XX:ErrorFile=/var/log/elasticsearch/hs_err_pid%p.log## JDK 8 GC logging
8:-XX:+PrintGCDetails
8:-XX:+PrintGCDateStamps
8:-XX:+PrintTenuringDistribution
8:-XX:+PrintGCApplicationStoppedTime
8:-Xloggc:/var/log/elasticsearch/gc.log
8:-XX:+UseGCLogFileRotation
8:-XX:NumberOfGCLogFiles=32
8:-XX:GCLogFileSize=64m# JDK 9+ GC logging
9-:-Xlog:gc*,gc+age=trace,safepoint:file=/var/log/elasticsearch/gc.log:utctime,pid,tags:filecount=32,filesize=64m
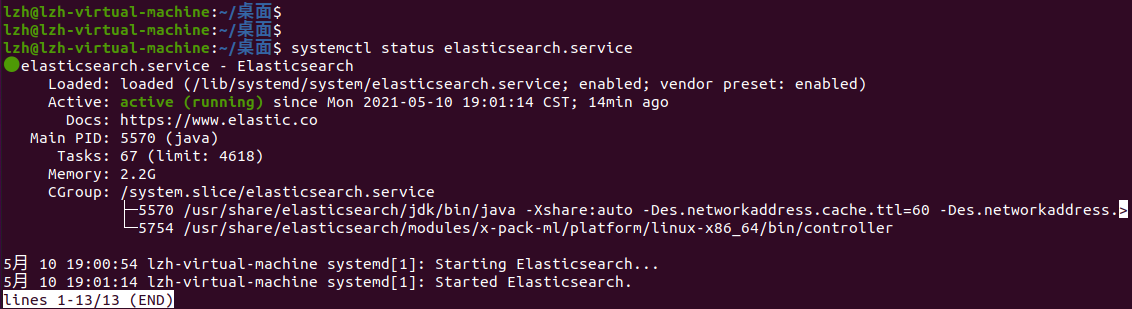
systemctl enable elasticsearch.service
systemctl start elasticsearch.service
systemctl status elasticsearch.service
cd /etc/kibana/
vim kibana.yml
root@lzh-virtual-machine:/etc/kibana# cat kibana.yml
# Kibana is served by a back end server. This setting specifies the port to use.
server.port: 5601# Specifies the address to which the Kibana server will bind. IP addresses and host names are both valid values.
# The default is 'localhost', which usually means remote machines will not be able to connect.
# To allow connections from remote users, set this parameter to a non-loopback address.
server.host: "0.0.0.0"# Enables you to specify a path to mount Kibana at if you are running behind a proxy.
# Use the `server.rewriteBasePath` setting to tell Kibana if it should remove the basePath
# from requests it receives, and to prevent a deprecation warning at startup.
# This setting cannot end in a slash.
# server.basePath: ""# Specifies whether Kibana should rewrite requests that are prefixed with
# `server.basePath` or require that they are rewritten by your reverse proxy.
# This setting was effectively always `false` before Kibana 6.3 and will
# default to `true` starting in Kibana 7.0.
#server.rewriteBasePath: false# The maximum payload size in bytes for incoming server requests.
#server.maxPayloadBytes: 1048576# The Kibana server's name.  This is used for display purposes.
#server.name: "your-hostname"# The URLs of the Elasticsearch instances to use for all your queries.
elasticsearch.hosts: ["http://192.168.191.129:9200"]# When this setting's value is true Kibana uses the hostname specified in the server.host
# setting. When the value of this setting is false, Kibana uses the hostname of the host
# that connects to this Kibana instance.
#elasticsearch.preserveHost: true# Kibana uses an index in Elasticsearch to store saved searches, visualizations and
# dashboards. Kibana creates a new index if the index doesn't already exist.
kibana.index: ".kibana"# The default application to load.
# kibana.defaultAppId: "home"# If your Elasticsearch is protected with basic authentication, these settings provide
# the username and password that the Kibana server uses to perform maintenance on the Kibana
# index at startup. Your Kibana users still need to authenticate with Elasticsearch, which
# is proxied through the Kibana server.
# elasticsearch.username: "lzh"
# elasticsearch.password: "lzh"# Enables SSL and paths to the PEM-format SSL certificate and SSL key files, respectively.
# These settings enable SSL for outgoing requests from the Kibana server to the browser.
#server.ssl.enabled: false
#server.ssl.certificate: /path/to/your/server.crt
#server.ssl.key: /path/to/your/server.key# Optional settings that provide the paths to the PEM-format SSL certificate and key files.
# These files are used to verify the identity of Kibana to Elasticsearch and are required when
# xpack.security.http.ssl.client_authentication in Elasticsearch is set to required.
#elasticsearch.ssl.certificate: /path/to/your/client.crt
#elasticsearch.ssl.key: /path/to/your/client.key# Optional setting that enables you to specify a path to the PEM file for the certificate
# authority for your Elasticsearch instance.
#elasticsearch.ssl.certificateAuthorities: [ "/path/to/your/CA.pem" ]# To disregard the validity of SSL certificates, change this setting's value to 'none'.
#elasticsearch.ssl.verificationMode: full# Time in milliseconds to wait for Elasticsearch to respond to pings. Defaults to the value of
# the elasticsearch.requestTimeout setting.
#elasticsearch.pingTimeout: 1500# Time in milliseconds to wait for responses from the back end or Elasticsearch. This value
# must be a positive integer.
#elasticsearch.requestTimeout: 30000# List of Kibana client-side headers to send to Elasticsearch. To send *no* client-side
# headers, set this value to [] (an empty list).
#elasticsearch.requestHeadersWhitelist: [ authorization ]# Header names and values that are sent to Elasticsearch. Any custom headers cannot be overwritten
# by client-side headers, regardless of the elasticsearch.requestHeadersWhitelist configuration.
#elasticsearch.customHeaders: {}# Time in milliseconds for Elasticsearch to wait for responses from shards. Set to 0 to disable.
#elasticsearch.shardTimeout: 30000# Time in milliseconds to wait for Elasticsearch at Kibana startup before retrying.
#elasticsearch.startupTimeout: 5000# Logs queries sent to Elasticsearch. Requires logging.verbose set to true.
#elasticsearch.logQueries: false# Specifies the path where Kibana creates the process ID file.
#pid.file: /var/run/kibana.pid# Enables you to specify a file where Kibana stores log output.
#logging.dest: stdout# Set the value of this setting to true to suppress all logging output.
#logging.silent: false# Set the value of this setting to true to suppress all logging output other than error messages.
#logging.quiet: false# Set the value of this setting to true to log all events, including system usage information
# and all requests.
#logging.verbose: false# Set the interval in milliseconds to sample system and process performance
# metrics. Minimum is 100ms. Defaults to 5000.
#ops.interval: 5000# Specifies locale to be used for all localizable strings, dates and number formats.
# Supported languages are the following: English - en , by default , Chinese - zh-CN .
i18n.locale: "zh-CN"
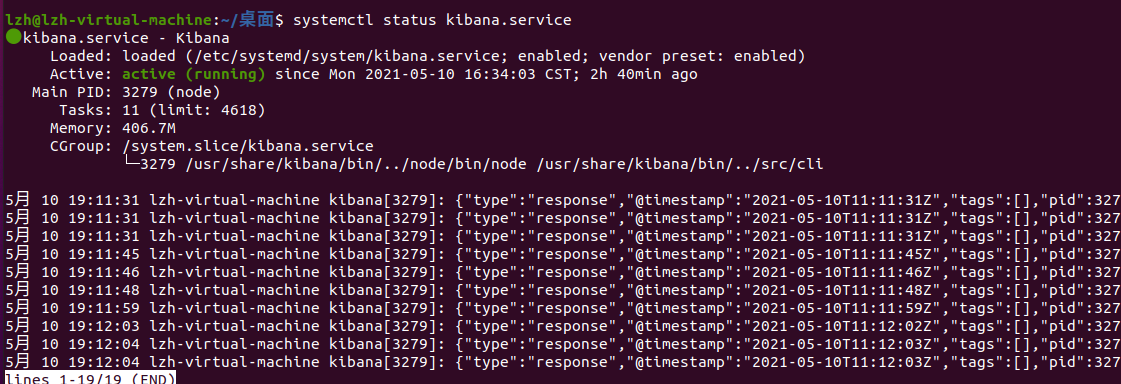
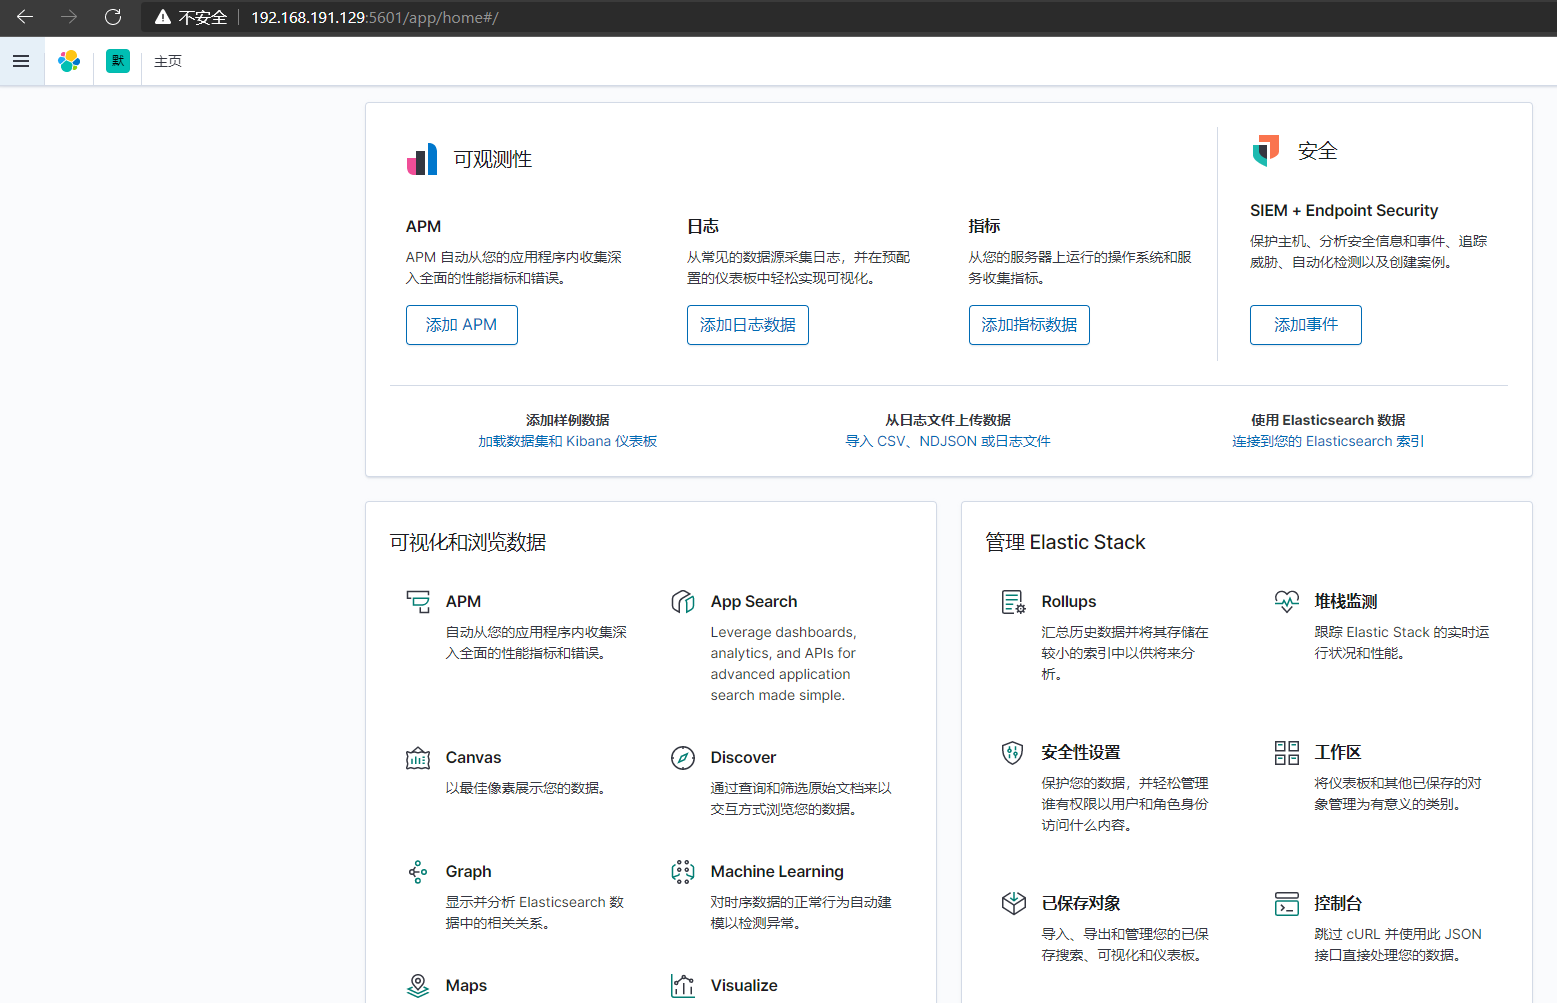
systemctl enable kibana.service
systemctl start kibana.service
systemctl status kibana.service
cd /etc/logstash/
vim logstash.yml
root@lzh-virtual-machine:/etc/logstash# cat logstash.yml
# Settings file in YAML
#
# Settings can be specified either in hierarchical form, e.g.:
#
# pipeline:
# batch:
# size: 125
# delay: 5
#
# Or as flat keys:
#
# pipeline.batch.size: 125
# pipeline.batch.delay: 5
#
# ------------ Node identity ------------
#
# Use a descriptive name for the node:
#
# node.name: test
#
# If omitted the node name will default to the machine's host name
#
# ------------ Data path ------------------
#
# Which directory should be used by logstash and its plugins
# for any persistent needs. Defaults to LOGSTASH_HOME/data
#
path.data: /var/lib/logstash
#
# ------------ Pipeline Settings --------------
#
# The ID of the pipeline.
#
# pipeline.id: main
#
# Set the number of workers that will, in parallel, execute the filters+outputs
# stage of the pipeline.
#
# This defaults to the number of the host's CPU cores.
#
# pipeline.workers: 2
#
# How many events to retrieve from inputs before sending to filters+workers
#
# pipeline.batch.size: 125
#
# How long to wait in milliseconds while polling for the next event
# before dispatching an undersized batch to filters+outputs
#
# pipeline.batch.delay: 50
#
# Force Logstash to exit during shutdown even if there are still inflight
# events in memory. By default, logstash will refuse to quit until all
# received events have been pushed to the outputs.
#
# WARNING: enabling this can lead to data loss during shutdown
#
# pipeline.unsafe_shutdown: false
#
# Set the pipeline event ordering. Options are "auto" (the default), "true" or "false".
# "auto" will automatically enable ordering if the 'pipeline.workers' setting
# is also set to '1'.
# "true" will enforce ordering on the pipeline and prevent logstash from starting
# if there are multiple workers.
# "false" will disable any extra processing necessary for preserving ordering.
#
pipeline.ordered: auto
#
# ------------ Pipeline Configuration Settings --------------
#
# Where to fetch the pipeline configuration for the main pipeline
#
# path.config:
#
# Pipeline configuration string for the main pipeline
#
# config.string:
#
# At startup, test if the configuration is valid and exit (dry run)
#
# config.test_and_exit: false
#
# Periodically check if the configuration has changed and reload the pipeline
# This can also be triggered manually through the SIGHUP signal
#
# config.reload.automatic: false
#
# How often to check if the pipeline configuration has changed (in seconds)
# Note that the unit value (s) is required. Values without a qualifier (e.g. 60)
# are treated as nanoseconds.
# Setting the interval this way is not recommended and might change in later versions.
#
# config.reload.interval: 3s
#
# Show fully compiled configuration as debug log message
# NOTE: --log.level must be 'debug'
#
# config.debug: false
#
# When enabled, process escaped characters such as \n and \" in strings in the
# pipeline configuration files.
#
# config.support_escapes: false
#
# ------------ HTTP API Settings -------------
# Define settings related to the HTTP API here.
#
# The HTTP API is enabled by default. It can be disabled, but features that rely
# on it will not work as intended.
# http.enabled: true
#
# By default, the HTTP API is bound to only the host's local loopback interface,
# ensuring that it is not accessible to the rest of the network. Because the API
# includes neither authentication nor authorization and has not been hardened or
# tested for use as a publicly-reachable API, binding to publicly accessible IPs
# should be avoided where possible.
#http.host: 0.0.0.0
#
# The HTTP API web server will listen on an available port from the given range.
# Values can be specified as a single port (e.g., `9600`), or an inclusive range
# of ports (e.g., `9600-9700`).
#http.port: 9600
#
# ------------ Module Settings ---------------
# Define modules here. Modules definitions must be defined as an array.
# The simple way to see this is to prepend each `name` with a `-`, and keep
# all associated variables under the `name` they are associated with, and
# above the next, like this:
#
# modules:
# - name: MODULE_NAME
# var.PLUGINTYPE1.PLUGINNAME1.KEY1: VALUE
# var.PLUGINTYPE1.PLUGINNAME1.KEY2: VALUE
# var.PLUGINTYPE2.PLUGINNAME1.KEY1: VALUE
# var.PLUGINTYPE3.PLUGINNAME3.KEY1: VALUE
#
# Module variable names must be in the format of
#
# var.PLUGIN_TYPE.PLUGIN_NAME.KEY
#
# modules:
#
# ------------ Cloud Settings ---------------
# Define Elastic Cloud settings here.
# Format of cloud.id is a base64 value e.g. dXMtZWFzdC0xLmF3cy5mb3VuZC5pbyRub3RhcmVhbCRpZGVudGlmaWVy
# and it may have an label prefix e.g. staging:dXMtZ...
# This will overwrite 'var.elasticsearch.hosts' and 'var.kibana.host'
# cloud.id:
#
# Format of cloud.auth is:
# This is optional
# If supplied this will overwrite 'var.elasticsearch.username' and 'var.elasticsearch.password'
# If supplied this will overwrite 'var.kibana.username' and 'var.kibana.password'
# cloud.auth: elastic:
#
# ------------ Queuing Settings --------------
#
# Internal queuing model, "memory" for legacy in-memory based queuing and
# "persisted" for disk-based acked queueing. Defaults is memory
#
# queue.type: memory
#
# If using queue.type: persisted, the directory path where the data files will be stored.
# Default is path.data/queue
#
# path.queue:
#
# If using queue.type: persisted, the page data files size. The queue data consists of
# append-only data files separated into pages. Default is 64mb
#
# queue.page_capacity: 64mb
#
# If using queue.type: persisted, the maximum number of unread events in the queue.
# Default is 0 (unlimited)
#
# queue.max_events: 0
#
# If using queue.type: persisted, the total capacity of the queue in number of bytes.
# If you would like more unacked events to be buffered in Logstash, you can increase the
# capacity using this setting. Please make sure your disk drive has capacity greater than
# the size specified here. If both max_bytes and max_events are specified, Logstash will pick
# whichever criteria is reached first
# Default is 1024mb or 1gb
#
# queue.max_bytes: 1024mb
#
# If using queue.type: persisted, the maximum number of acked events before forcing a checkpoint
# Default is 1024, 0 for unlimited
#
# queue.checkpoint.acks: 1024
#
# If using queue.type: persisted, the maximum number of written events before forcing a checkpoint
# Default is 1024, 0 for unlimited
#
# queue.checkpoint.writes: 1024
#
# If using queue.type: persisted, the interval in milliseconds when a checkpoint is forced on the head page
# Default is 1000, 0 for no periodic checkpoint.
#
# queue.checkpoint.interval: 1000
#
# ------------ Dead-Letter Queue Settings --------------
# Flag to turn on dead-letter queue.
#
# dead_letter_queue.enable: false# If using dead_letter_queue.enable: true, the maximum size of each dead letter queue. Entries
# will be dropped if they would increase the size of the dead letter queue beyond this setting.
# Default is 1024mb
# dead_letter_queue.max_bytes: 1024mb# If using dead_letter_queue.enable: true, the directory path where the data files will be stored.
# Default is path.data/dead_letter_queue
#
# path.dead_letter_queue:
#
# ------------ Metrics Settings --------------
#
# Bind address for the metrics REST endpoint
#
# http.host: "0.0.0.0"
#
# Bind port for the metrics REST endpoint, this option also accept a range
# (9600-9700) and logstash will pick up the first available ports.
#
# http.port: 9600
#
# ------------ Debugging Settings --------------
#
# Options for log.level:
# * fatal
# * error
# * warn
# * info (default)
# * debug
# * trace
#
# log.level: info
path.logs: /var/log/logstash
#
# ------------ Other Settings --------------
#
# Where to find custom plugins
# path.plugins: []
#
# Flag to output log lines of each pipeline in its separate log file. Each log filename contains the pipeline.name
# Default is false
# pipeline.separate_logs: false
#
# ------------ X-Pack Settings (not applicable for OSS build)--------------
#
# X-Pack Monitoring
# https://www.elastic.co/guide/en/logstash/current/monitoring-logstash.html
#xpack.monitoring.enabled: false
#xpack.monitoring.elasticsearch.username: logstash_system
#xpack.monitoring.elasticsearch.password: password
#xpack.monitoring.elasticsearch.proxy: ["http://proxy:port"]
#xpack.monitoring.elasticsearch.hosts: ["https://es1:9200", "https://es2:9200"]
# an alternative to hosts + username/password settings is to use cloud_id/cloud_auth
#xpack.monitoring.elasticsearch.cloud_id: monitoring_cluster_id:xxxxxxxxxx
#xpack.monitoring.elasticsearch.cloud_auth: logstash_system:password
# another authentication alternative is to use an Elasticsearch API key
#xpack.monitoring.elasticsearch.api_key: "id:api_key"
#xpack.monitoring.elasticsearch.ssl.certificate_authority: [ "/path/to/ca.crt" ]
#xpack.monitoring.elasticsearch.ssl.truststore.path: path/to/file
#xpack.monitoring.elasticsearch.ssl.truststore.password: password
#xpack.monitoring.elasticsearch.ssl.keystore.path: /path/to/file
#xpack.monitoring.elasticsearch.ssl.keystore.password: password
#xpack.monitoring.elasticsearch.ssl.verification_mode: certificate
#xpack.monitoring.elasticsearch.sniffing: false
#xpack.monitoring.collection.interval: 10s
#xpack.monitoring.collection.pipeline.details.enabled: true
#
# X-Pack Management
# https://www.elastic.co/guide/en/logstash/current/logstash-centralized-pipeline-management.html
#xpack.management.enabled: false
#xpack.management.pipeline.id: ["main", "apache_logs"]
#xpack.management.elasticsearch.username: logstash_admin_user
#xpack.management.elasticsearch.password: password
#xpack.management.elasticsearch.proxy: ["http://proxy:port"]
#xpack.management.elasticsearch.hosts: ["https://es1:9200", "https://es2:9200"]
# an alternative to hosts + username/password settings is to use cloud_id/cloud_auth
#xpack.management.elasticsearch.cloud_id: management_cluster_id:xxxxxxxxxx
#xpack.management.elasticsearch.cloud_auth: logstash_admin_user:password
# another authentication alternative is to use an Elasticsearch API key
#xpack.management.elasticsearch.api_key: "id:api_key"
#xpack.management.elasticsearch.ssl.certificate_authority: [ "/path/to/ca.crt" ]
#xpack.management.elasticsearch.ssl.truststore.path: /path/to/file
#xpack.management.elasticsearch.ssl.truststore.password: password
#xpack.management.elasticsearch.ssl.keystore.path: /path/to/file
#xpack.management.elasticsearch.ssl.keystore.password: password
#xpack.management.elasticsearch.ssl.verification_mode: certificate
#xpack.management.elasticsearch.sniffing: false
#xpack.management.logstash.poll_interval: 5s
vi /etc/logstash/conf.d/elk.conf
elk.conf文件内容
root@lzh-virtual-machine:/etc/logstash# cat  /etc/logstash/conf.d/elk.conf
input {# For detail config for log4j as input,# See: https://www.elastic.co/guide/en/logstash/current/plugins-inputs-log4j.htmltcp {mode => "server"host => "0.0.0.0"port => 4567codec => json_lines}
}
filter {#Only matched data are send to output.
}
output {# For detail config for elasticsearch as output,# See: https://www.elastic.co/guide/en/logstash/current/plugins-outputs-elasticsearch.htmlelasticsearch {action => "index"          #The operation on EShosts  => "localhost:9200"   #ElasticSearch host, can be array.index  => "%{[appname]}"      #The index to write data to.}
}
ln -s /usr/share/logstash/bin/logstash /bin/
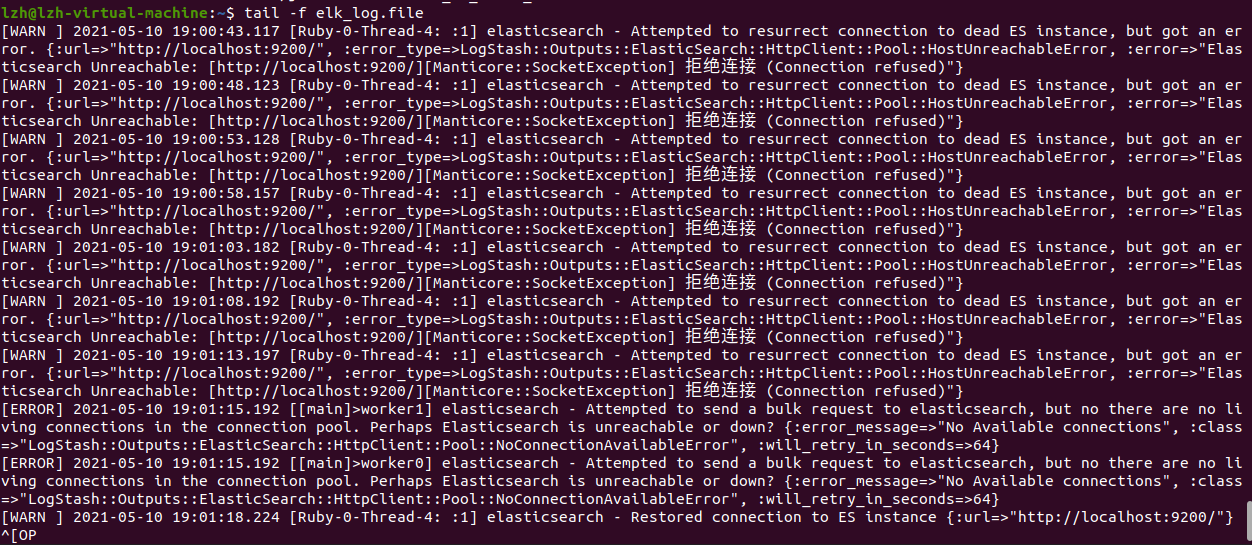
nohup logstash -f /etc/logstash/conf.d/elk.conf > /home/lzh/elk_log.file 2>&1 &
tail -f elk_log.file


 京公网安备 11010802041100号 | 京ICP备19059560号-4 | PHP1.CN 第一PHP社区 版权所有