(X_train, y_train), (X_test, y_test) = mnist.load_data()
print('X_train shape:', X_train.shape)
print('X_test shape: ', X_test.shape)
print('y_train shape:',y_train.shape)
print('y_test shape: ', y_test.shape)
全部代码:
# Import Numpy, keras and MNIST data
import numpy as np
import matplotlib.pyplot as pltfrom keras.datasets import mnist
from keras.models import Sequential
from keras.layers.core import Dense, Dropout, Activation
from keras.utils import np_utils# Retrieve the training and test data
(X_train, y_train), (X_test, y_test) = mnist.load_data()
print('X_train shape:', X_train.shape)
print('X_test shape: ', X_test.shape)
print('y_train shape:',y_train.shape)
print('y_test shape: ', y_test.shape)# Visualizing the data
import matplotlib.pyplot as plt
%matplotlib inline# Function for displaying a training image by it's index in the MNIST set
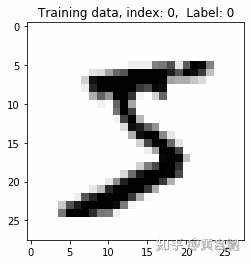
def display_digit(index):label = y_train[index].argmax(axis=0)image = X_train[index]plt.title('Training data, index: %d, Label: %d' % (index, label))plt.imshow(image, cmap='gray_r')plt.show()# Display the first (index 0) training image
display_digit(0)X_train = X_train.reshape(60000, 784)
X_test = X_test.reshape(10000, 784)
X_train = X_train.astype('float32')
X_test = X_test.astype('float32')
X_train /= 255
X_test /= 255
print("Training matrix shape", X_train.shape)
print("Testing matrix shape", X_test.shape)#One Hot encoding of labels.
from keras.utils.np_utils import to_categorical
print(y_train.shape)
y_train = to_categorical(y_train, 10)
y_test = to_categorical(y_test, 10)
print(y_train.shape)# Define the neural network
def build_model():model = Sequential()model.add(Dense(512, input_shape=(784,)))model.add(Activation('relu')) # An "activation" is just a non-linear function applied to the output# of the layer above. Here, with a "rectified linear unit",# we clamp all values below 0 to 0.model.add(Dropout(0.2)) # Dropout helps protect the model from memorizing or "overfitting" the training datamodel.add(Dense(512))model.add(Activation('relu'))model.add(Dropout(0.2))model.add(Dense(10))model.add(Activation('softmax')) # This special "softmax" activation among other things,# ensures the output is a valid probaility distribution, that is# that its values are all non-negative and sum to 1.return model# Build the model
model = build_model()model.compile(optimizer='rmsprop',loss='categorical_crossentropy',metrics=['accuracy'])# Training
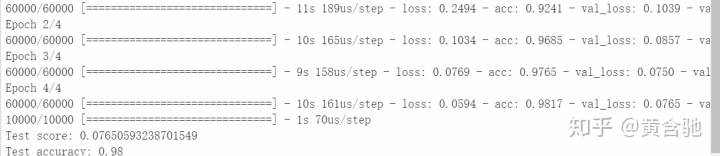
model.fit(X_train, y_train, batch_size=128, nb_epoch=4, verbose=1,validation_data=(X_test, y_test))# Compare the labels that our model predicts with the actual labelsscore = model.evaluate(X_test, y_test, batch_size=32, verbose=1,sample_weight=None)
# Print out the result
print('Test score:', score[0])
print('Test accuracy:', score[1])
Downloading data from https://s3.amazonaws.com/img-datasets/mnist.npz 11493376/11490434 [==============================] - 1s 0us/step X_train shape: (60000, 28, 28)
X_test shape: (10000, 28, 28) y_train shape: (60000,) y_test shape: (10000,)
Training matrix shape (60000, 784)
Testing matrix shape (10000, 784)
(60000,)
(60000, 10)
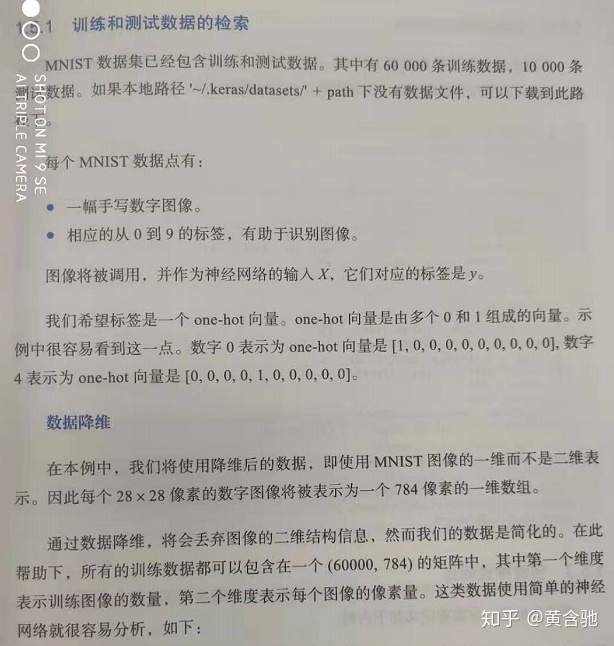
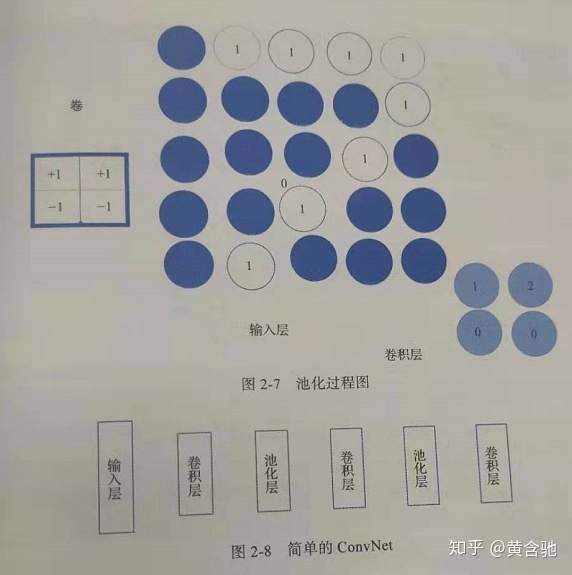
①卷积神经网络中,卷积层有助于检测图像中的区域分布。最大池化层位于卷积层之后,有助于减小维数。下面是一个图像分类的例子。在图像分类之前,先将所有图像转成标准大小。之后实验中我们将训练一个CNN,然后对CIFAR-10图像分类。(60000幅32*32彩色图像数据集,10个类别,每类6000幅图像。
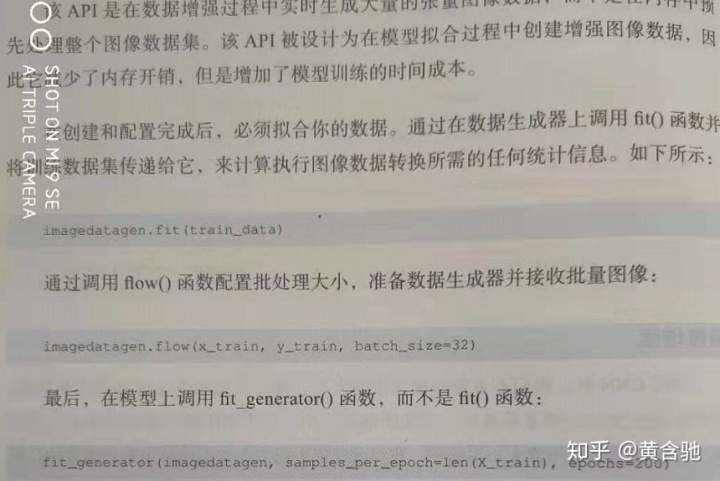
②训练CNN时我们不希望根据图像大小、角度和位置改变模型的预测结果。为了使模型对图像大小、反向不敏感,可以将不同大小、不同角度的图像加入数据集。这个过程较图像数据增强,有助于过拟合。但这样可能还不够,因为增强的图像仍然是相关的。keras提供了一个图像增强类imageDataGenerator,它定义了图像数据增强的相关配置和其他属性如:
● sample--wise和 feature--wise标准化
● 图像的随机旋转、移位、剪切和缩放。
● 水平和垂直翻转。
●维度重排。
● 将变化存储至磁盘。
如下创建一个图像增强生成器:
datagen_train = ImageDataGenerator()
③关于dropout、卷积层、池化层的详解,见本文末图片~(超简明直白哒!)
import keras
from keras.datasets import cifar10# load the pre-shuffled train and test data
# link to dataset: https://www.cs.toronto.edu/~kriz/cifar.html
(x_train, y_train), (x_test, y_test) = cifar10.load_data()
import numpy as np
import matplotlib.pyplot as plt
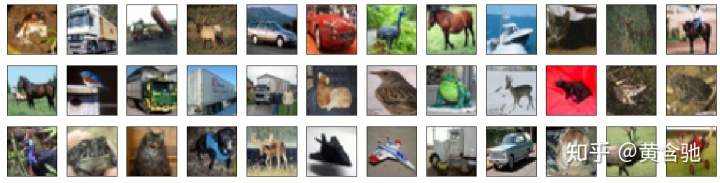
%matplotlib inlinefig = plt.figure(figsize=(20,5))
for i in range(36):ax = fig.add_subplot(3, 12, i + 1, xticks=[], yticks=[])ax.imshow(np.squeeze(x_train[i]))
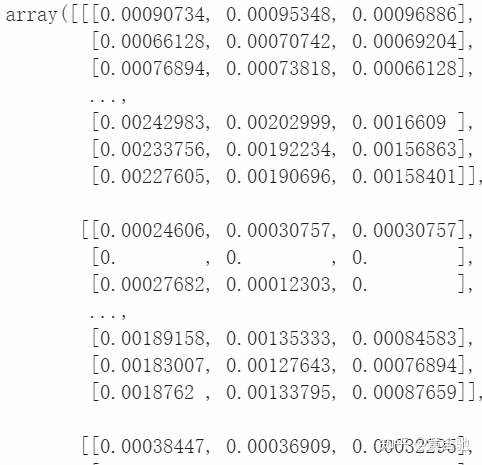
# rescale [0,255] --> [0,1]
x_train = x_train.astype('float32')/255
x_test = x_test.astype('float32')/255
x_train[0]
y_train[0]
array([6], dtype=uint8)
from keras.utils import np_utils# break training set into training and validation sets
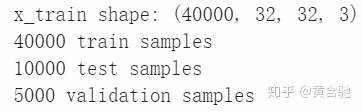
(x_train, x_valid) = x_train[5000:], x_train[:5000]
(y_train, y_valid) = y_train[5000:], y_train[:5000]# one-hot encode the labels
num_classes = len(np.unique(y_train))
y_train = keras.utils.to_categorical(y_train, num_classes)
y_test = keras.utils.to_categorical(y_test, num_classes)
y_valid = keras.utils.to_categorical(y_valid, num_classes)# print shape of training set
print('x_train shape:', x_train.shape)# print number of training, validation, and test images
print(x_train.shape[0], 'train samples')
print(x_test.shape[0], 'test samples')
print(x_valid.shape[0], 'validation samples')
from keras.preprocessing.image import ImageDataGenerator# create and configure augmented image generator
datagen_train = ImageDataGenerator(width_shift_range=0.1, # randomly shift images horizontally (10% of total width)height_shift_range=0.1, # randomly shift images vertically (10% of total height)horizontal_flip=True) # randomly flip images horizontally# fit augmented image generator on data
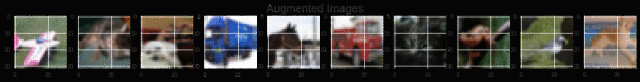
datagen_train.fit(x_train)#在这里我们可以看到增强的图像。我们从训练数据中获取10张图像,并查看原始数据和增强数据。尝试将原始图像与增强后的图像进行匹配。
#哪些是水平翻转的?
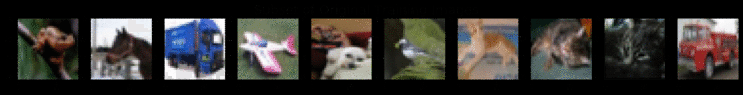
#哪些是水平和垂直shiffted的?import matplotlib.pyplot as pltnum_to_view = 10# take subset of training data
x_train_subset = x_train[:num_to_view]# visualize subset of training data
fig = plt.figure(figsize=(20,2))
for i in range(0, len(x_train_subset)):ax = fig.add_subplot(1, num_to_view, i+1)ax.imshow(x_train_subset[i])
fig.suptitle('Subset of Original Training Images', fontsize=20)
plt.show()# visualize augmented images
fig = plt.figure(figsize=(20,2))
for x_batch in datagen_train.flow(x_train_subset, batch_size=12):for i in range(0, num_to_view):ax = fig.add_subplot(1, num_to_view, i+1)ax.imshow(x_batch[i])fig.suptitle('Augmented Images', fontsize=20)plt.show()break;
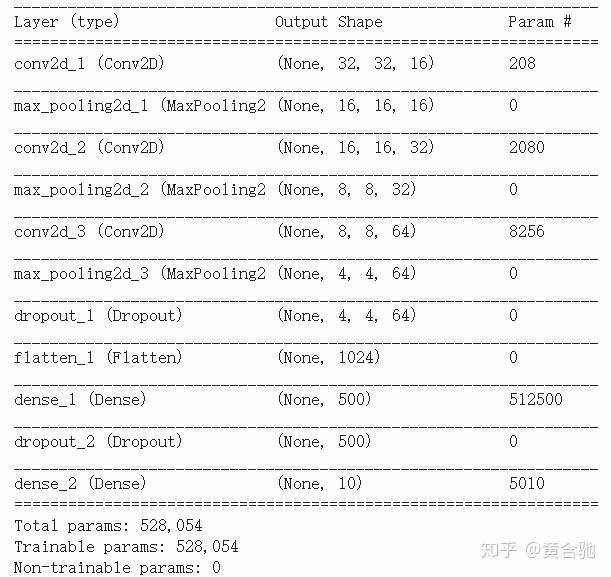
一旦我们有了增强的图像,我们现在可以定义我们的架构,它将应用于增强的图像。
from keras import backend as K
K.clear_session()from keras.models import Sequential
from keras.layers import Conv2D, MaxPooling2D, Flatten, Dense, Dropoutmodel = Sequential()
model.add(Conv2D(filters=16, kernel_size=2, padding='same', activation='relu', input_shape=(32, 32, 3)))
model.add(MaxPooling2D(pool_size=2))
model.add(Conv2D(filters=32, kernel_size=2, padding='same', activation='relu'))
model.add(MaxPooling2D(pool_size=2))
model.add(Conv2D(filters=64, kernel_size=2, padding='same', activation='relu'))
model.add(MaxPooling2D(pool_size=2))
model.add(Dropout(0.3))
model.add(Flatten())
model.add(Dense(500, activation='relu'))
model.add(Dropout(0.4))
model.add(Dense(10, activation='softmax'))model.summary()
# compile the model
model.compile(loss='categorical_crossentropy', optimizer='rmsprop', metrics=['accuracy'])
datagren.flow生成批量的增强图像。您可以为它提供训练图像和标签,以及希望批量生成的图像数量。
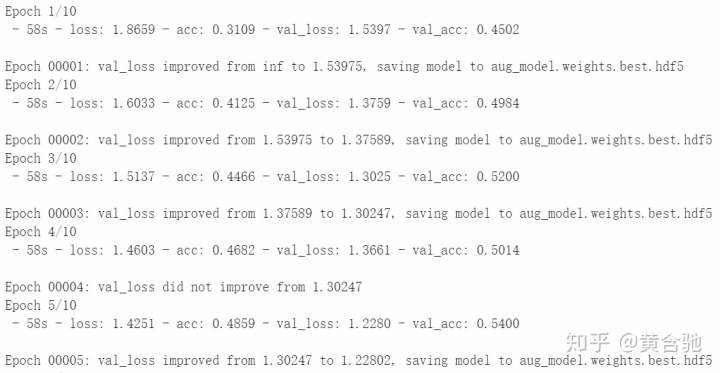
from keras.callbacks import ModelCheckpoint   batch_size = 32
epochs = 10# train the model
checkpointer = ModelCheckpoint(filepath='aug_model.weights.best.hdf5', verbose=1, save_best_only=True)# datagren.flow makes batches of augmented images. You provide it with the
# training images and labels along with the number of images you want to be
# generated in a batch.
model.fit_generator(datagen_train.flow(x_train, y_train, batch_size=batch_size),steps_per_epoch=x_train.shape[0] // batch_size,epochs=epochs, verbose=2, callbacks=[checkpointer],validation_data=(x_valid, y_valid),validation_steps=x_valid.shape[0] // batch_size)
# load the weights that yielded the best validation accuracy
model.load_weights('aug_model.weights.best.hdf5')
# evaluate and print test accuracy
score = model.evaluate(x_test, y_test, verbose=0)
print('n', 'Test accuracy:', score[1])
Test accuracy: 0.6191
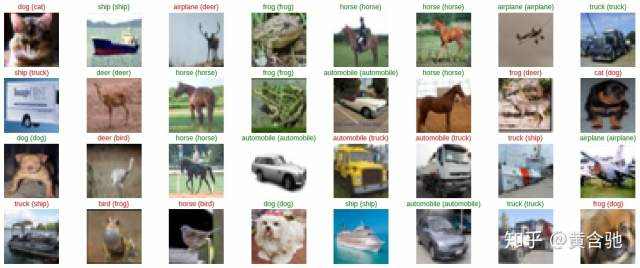
# get predictions on the test set
y_hat = model.predict(x_test)# define text labels (source: https://www.cs.toronto.edu/~kriz/cifar.html)
cifar10_labels = ['airplane', 'automobile', 'bird', 'cat', 'deer', 'dog', 'frog', 'horse', 'ship', 'truck']
# plot a random sample of test images, their predicted labels, and ground truth
fig = plt.figure(figsize=(20, 8))
for i, idx in enumerate(np.random.choice(x_test.shape[0], size=32, replace=False)):ax = fig.add_subplot(4, 8, i + 1, xticks=[], yticks=[])ax.imshow(np.squeeze(x_test[idx]))pred_idx = np.argmax(y_hat[idx])true_idx = np.argmax(y_test[idx])ax.set_title("{} ({})".format(cifar10_labels[pred_idx], cifar10_labels[true_idx]),color=("green" if pred_idx == true_idx else "red"))
我个人喜欢手动扩展数据。我使用 aleju/imgaug
## 这里有一个方便的Keras备忘单:https://s3.amazonaws.com/assets.datacamp.com/blog_assets/Keras_Cheat_Sheet_Python.pdf
## CIFAR-10获奖者访谈:
CIFAR-10 Competition Winners: Interviews with Dr. Ben Graham, Phil Culliton, & Zygmunt Zając
##著名的CNN架构,通常用于工业和学术研究:http://papers.nips.cc/paper/4824-imagenet-classification-with-deep-convolutional-neural-networks.pdfhttps://arxiv.org/pdf/1409.1556.pdf
参考资料:
《Practical Convolutional Neural Networks: Implement advanced deep learning models using Python Paperback》https://github.com/huanghanchi/Practical-Convolutional-Neural-Networks/blob/master/Chapter02/CNN_3.pyhttps://colab.research.google.com/drive/1hn284Jk4KDlHbgU1b9sQLJPp5fpyA9G5#scrollTo=J9AiuBpgt6HS
关于dropout、卷积层、池化层的详解


 京公网安备 11010802041100号 | 京ICP备19059560号-4 | PHP1.CN 第一PHP社区 版权所有