在第一节的中我们说druid提供了监控的功能。那么这个监控的功能如何实现。首先我们要明确的是监控的本质就是通过代理模式对调用的方法进行统计。那么druid应该也是类似。但是我们在昨天的分析中说init()方法中有filter,这些filter又是做那些工作的。是否和监控有联系,这里先自己手写一个filter,据此来深入学习其原理和过程。
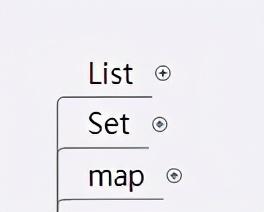
1.定义过滤器,实现接口filtereventapter@Componentpublic class MysqlLogFilter extends FilterEventAdapter { protected void statementExecuteUpdateBefore(StatementProxy statement, String sql) { } protected void statementExecuteUpdateAfter(StatementProxy statement, String sql, int updateCount) { showLog(sql); } protected void statementExecuteQueryBefore(StatementProxy statement, String sql) { } protected void statementExecuteQueryAfter(StatementProxy statement, String sql, ResultSetProxy resultSet) { showLog(sql); } protected void statementExecuteBefore(StatementProxy statement, String sql) { } protected void statementExecuteAfter(StatementProxy statement, String sql, boolean result) { showLog(sql); } public void showLog(String sql){ System.out.println("测试"+sql); }}执行效果 首先考虑一下,这里如何分辨出这个bean要被durid使用,我们说spring中有接口beanpostprecessors,那么这里有没有使用,那么durid是如何识别的?通过一番查找,作者在druid的starter中找到了注入的方式。是采用list进行注入的。也就是说我们的filters其实在初始化的时候保存在dataseource中。
 那么我们自定义的拦截器是如何执行的?我们还是根据sql的执行逻辑来看这个问题,首先是获取连接,然后通过连接得到statement,然后执行execute方法。那么我们从getconnection方法中查看。
public DruidPooledConnection getConnection(long maxWaitMillis) throws SQLException { init();//如果有过滤器 if (filters.size() > 0) {//初始化一个过滤器链 FilterChainImpl filterChain = new FilterChainImpl(this);//返回一个druidPooledConnction return filterChain.dataSource_connect(this, maxWaitMillis); } else { return getConnectionDirect(maxWaitMillis); } }//初始化 public FilterChainImpl(DataSourceProxy dataSource){ this.dataSource = dataSource; this.filterSize = getFilters().size(); }//从datasoruce中获取过滤器 public ListgetFilters() { return dataSource.getProxyFilters(); } @Override public DruidPooledConnection dataSource_connect(DruidDataSource dataSource, long maxWaitMillis) throws SQLException {//这里递归的对各种filterevent进行一些参数的设置。但是确实最后执行的。 if (this.pos 获取连接之后进行执行sql的时候,通过jdk动态代理执行。这里的statement就是getconnection获取的statement的封装。 而这里封装返回来的statement就是这里的PreparedStatementProxyImpl。我们继续看一下里边的逻辑。
 最终会执行方法preparedStatement_execute
public boolean preparedStatement_execute(FilterChain chain, PreparedStatementProxy statement) throws SQLException { try {//执行一下处理的前置方法 this.statementExecuteBefore(statement, statement.getSql());//递归执行过滤器的方法 boolean firstResult = chain.preparedStatement_execute(statement);//执行结束之后的操作 this.statementExecuteAfter(statement, statement.getSql(), firstResult); return firstResult; } catch (SQLException var4) { this.statement_executeErrorAfter(statement, statement.getSql(), var4); throw var4; } catch (RuntimeException var5) { this.statement_executeErrorAfter(statement, statement.getSql(), var5); throw var5; } catch (Error var6) { this.statement_executeErrorAfter(statement, statement.getSql(), var6); throw var6; } }这里我们注意到druid的处理并没有采用mybatis插件那种机制,反而采用类似递归的方式,这个和springmvc的拦截器很类似。总结:durid通过注入数组的方式将druid拦截器注入到datasource中。在执行sql的时候先获取connection过程中采用递归的方式对该sql的执行的先前连接信息记录,并在获取连接之后封装成PreparedStatementProxyImpl,在进行jdk动态代理执行sql的时候,逐个递归的执行注入进来的拦截器FilterEventAdapter中的方法,从而完成sql的统计统计和监视功能。在查看代码的过程中,作者也发现druid其实也有对慢查询日志的监听功能。配置如下:
spring.datasource.druid.filter.stat.enabled=truespring.datasource.druid.filter.stat.log-slow-sql=truespring.datasource.druid.filter.stat.slow-sql-millis=10


 京公网安备 11010802041100号