1 metrics
# curl http://localhost:8088/ws/v1/cluster/metrics
The cluster metrics resource provides some overall metrics about the cluster. More detailed metrics should be retrieved from the jmx interface.
{
  "clusterMetrics":
  {
    "appsSubmitted":0,
    "appsCompleted":0,
    "appsPending":0,
    "appsRunning":0,
    "appsFailed":0,
    "appsKilled":0,
    "reservedMB":0,
    "availableMB":17408,
    "allocatedMB":0,
    "reservedVirtualCores":0,
    "availableVirtualCores":7,
    "allocatedVirtualCores":1,
    "containersAllocated":0,
    "containersReserved":0,
    "containersPending":0,
    "totalMB":17408,
    "totalVirtualCores":8,
    "totalNodes":1,
    "lostNodes":0,
    "unhealthyNodes":0,
    "decommissionedNodes":0,
    "rebootedNodes":0,
    "activeNodes":1
  }
}
2 scheduler
# curl http://localhost:8088/ws/v1/cluster/scheduler
A scheduler resource contains information about the current scheduler configured in a cluster. It currently supports both the Fifo and Capacity Scheduler. You will get different information depending on which scheduler is configured so be sure to look at the type information.
{
    "scheduler": {
        "schedulerInfo": {
            "capacity": 100.0,
            "maxCapacity": 100.0,
            "queueName": "root",
            "queues": {
                "queue": [
                    {
                        "absoluteCapacity": 10.5,
                        "absoluteMaxCapacity": 50.0,
                        "absoluteUsedCapacity": 0.0,
                        "capacity": 10.5,
                        "maxCapacity": 50.0,
                        "numApplications": 0,
                        "queueName": "a",
                        "queues": {
                            "queue": [
                                {
                                    "absoluteCapacity": 3.15,
                                    "absoluteMaxCapacity": 25.0,
                                    "absoluteUsedCapacity": 0.0,
                                    "capacity": 30.000002,
                                    "maxCapacity": 50.0,
                                    "numApplications": 0,
                                    "queueName": "a1",
...
3 apps
# curl http://localhost:8088/ws/v1/cluster/apps
With the Applications API, you can obtain a collection of resources, each of which represents an application. When you run a GET operation on this resource, you obtain a collection of Application Objects.
支持参数:
* state [deprecated] - state of the application
* states - applications matching the given application states, specified as a comma-separated list.
* finalStatus - the final status of the application - reported by the application itself
* user - user name
* queue - queue name
* limit - total number of app objects to be returned
* startedTimeBegin - applications with start time beginning with this time, specified in ms since epoch
* startedTimeEnd - applications with start time ending with this time, specified in ms since epoch
* finishedTimeBegin - applications with finish time beginning with this time, specified in ms since epoch
* finishedTimeEnd - applications with finish time ending with this time, specified in ms since epoch
* applicationTypes - applications matching the given application types, specified as a comma-separated list.
* applicationTags - applications matching any of the given application tags, specified as a comma-separated list.
{
  "apps":
  {
    "app":
    [
       {
          "finishedTime" : 1326815598530,
          "amContainerLogs" : "http://host.domain.com:8042/node/containerlogs/container_1326815542473_0001_01_000001",
          "trackingUI" : "History",
          "state" : "FINISHED",
          "user" : "user1",
          "id" : "application_1326815542473_0001",
          "clusterId" : 1326815542473,
          "finalStatus" : "SUCCEEDED",
          "amHostHttpAddress" : "host.domain.com:8042",
          "progress" : 100,
          "name" : "word count",
          "startedTime" : 1326815573334,
          "elapsedTime" : 25196,
          "diagnostics" : "",
          "trackingUrl" : "http://host.domain.com:8088/proxy/application_1326815542473_0001/jobhistory/job/job_1326815542473_1_1",
          "queue" : "default",
          "allocatedMB" : 0,
          "allocatedVCores" : 0,
          "runningContainers" : 0,
          "memorySeconds" : 151730,
          "vcoreSeconds" : 103
       },
       {
          "finishedTime" : 1326815789546,
          "amContainerLogs" : "http://host.domain.com:8042/node/containerlogs/container_1326815542473_0002_01_000001",
          "trackingUI" : "History",
          "state" : "FINISHED",
          "user" : "user1",
          "id" : "application_1326815542473_0002",
          "clusterId" : 1326815542473,
          "finalStatus" : "SUCCEEDED",
          "amHostHttpAddress" : "host.domain.com:8042",
          "progress" : 100,
          "name" : "Sleep job",
          "startedTime" : 1326815641380,
          "elapsedTime" : 148166,
          "diagnostics" : "",
          "trackingUrl" : "http://host.domain.com:8088/proxy/application_1326815542473_0002/jobhistory/job/job_1326815542473_2_2",
          "queue" : "default",
          "allocatedMB" : 0,
          "allocatedVCores" : 0,
          "runningContainers" : 1,
          "memorySeconds" : 640064,
          "vcoreSeconds" : 442
       }
    ]
  }
}
收集shell脚本示例
metrics
#!/bin/sh

cluster_name="c1"
rms="192.168.0.1 192.168.0.2"

url_path="/ws/v1/cluster/metrics"
keyword="clusterMetrics"
log_name="metrics.log"

base_dir="/tmp"
log_path=${base_dir}/${log_name}

echo "`date +\'%Y-%m-%d %H:%M:%S\'`"
for rm in $rms
do
        url="http://${rm}:8088${url_path}"
        echo $url
        cOntent=`curl $url`
        echo $content
        if [[ "$content" == *"$keyword"* ]]; then
                break
        fi
done
if [[ "$content" == *"$keyword"* ]]; then
        modified="${content:0:$((${#content}-1))},\"currentTime\":`date +%s`,\"clusterName\":\"${cluster_name}\"}"
        echo "$modified"
        echo "$modified" >> $log_path
else
        echo "gather metrics failed from : ${rms}, ${url_path}, ${keyword}"
fi
apps
#!/bin/sh

cluster_name="c1"
rms="192.168.0.1 192.168.0.2"

url_path="/ws/v1/cluster/apps?states=RUNNING"
keyword="apps"
log_name="apps.log"

base_dir="/tmp"
log_path=${base_dir}/${log_name}

echo "`date +\'%Y-%m-%d %H:%M:%S\'`"
for rm in $rms
do
        url="http://${rm}:8088${url_path}"
        echo $url
        cOntent=`curl $url`
        echo $content
        if [[ "$content" == *"$keyword"* ]]; then
                break
        fi
done
if [[ "$content" == *"$keyword"* ]]; then
        if [[ "$content" == *"application_"* ]]; then
                postfix=",\"currentTime\":`date +%s`,\"clusterName\":\"${cluster_name}\"}"
                modified="${content:16:$((${#content}-20))}"
                echo "${modified//\"/\\\"}"|awk \'{split($0,arr,"},"); for (i in arr) {print arr[i]}}\'|xargs -i echo "{}$postfix" >> $log_path
        else
                echo "no apps is running"
        fi
else
        echo "gather metrics failed from : ${rms}, ${url_path}, ${keyword}"
fi
然后对接ELK
ELK
Logstash配置示例
metrics1:input json+filter mutate rename
input {
  file {
    path => "/tmp/metrics.log"
    codec => "json"
  }
}
filter {
  mutate {
    rename => {
      "[clusterMetrics][appsSubmitted]" => "[appsSubmitted]"
      "[clusterMetrics][appsCompleted]" => "[appsCompleted]"
      "[clusterMetrics][appsPending]" => "[appsPending]"
      "[clusterMetrics][appsRunning]" => "[appsRunning]"
      "[clusterMetrics][appsFailed]" => "[appsFailed]"
      "[clusterMetrics][appsKilled]" => "[appsKilled]"
      "[clusterMetrics][reservedMB]" => "[reservedMB]"
      "[clusterMetrics][availableMB]" => "[availableMB]"
      "[clusterMetrics][allocatedMB]" => "[allocatedMB]"
      "[clusterMetrics][reservedVirtualCores]" => "[reservedVirtualCores]"
      "[clusterMetrics][availableVirtualCores]" => "[availableVirtualCores]"
      "[clusterMetrics][allocatedVirtualCores]" => "[allocatedVirtualCores]"
      "[clusterMetrics][containersAllocated]" => "[containersAllocated]"
      "[clusterMetrics][containersReserved]" => "[containersReserved]"
      "[clusterMetrics][containersPending]" => "[containersPending]"
      "[clusterMetrics][totalMB]" => "[totalMB]"
      "[clusterMetrics][totalVirtualCores]" => "[totalVirtualCores]"
      "[clusterMetrics][totalNodes]" => "[totalNodes]"
      "[clusterMetrics][lostNodes]" => "[lostNodes]"
      "[clusterMetrics][unhealthyNodes]" => "[unhealthyNodes]"
      "[clusterMetrics][decommissionedNodes]" => "[decommissionedNodes]"
      "[clusterMetrics][rebootedNodes]" => "[rebootedNodes]"
      "[clusterMetrics][activeNodes]" => "[activeNodes]"
    }
    remove_field => ["clusterMetrics", "path"]
  }
#  ruby {
#    code => "event.set(\'@timestamp\', LogStash::Timestamp.at(event.get(\'currentTime\') + 28800))"
#  }
  date {
    match => [ "currentTime","UNIX"]
    target => "@timestamp"
  }
}
metrics2:filter json+filter mutate add_field
input {
  file {
    path => "/tmp/metrics.log"
  }
}
filter {
  json {
    source => "message"
  }
  mutate {
    add_field => {
      "appsSubmitted" => "%{[clusterMetrics][appsSubmitted]}"
      "appsCompleted" => "%{[clusterMetrics][appsCompleted]}"
      "appsPending" => "%{[clusterMetrics][appsPending]}"
      "appsRunning" => "%{[clusterMetrics][appsRunning]}"
      "appsFailed" => "%{[clusterMetrics][appsFailed]}"
      "appsKilled" => "%{[clusterMetrics][appsKilled]}"
      "reservedMB" => "%{[clusterMetrics][reservedMB]}"
      "availableMB" => "%{[clusterMetrics][availableMB]}"
      "allocatedMB" => "%{[clusterMetrics][allocatedMB]}"
      "reservedVirtualCores" => "%{[clusterMetrics][reservedVirtualCores]}"
      "availableVirtualCores" => "%{[clusterMetrics][availableVirtualCores]}"
      "allocatedVirtualCores" => "%{[clusterMetrics][allocatedVirtualCores]}"
      "containersAllocated" => "%{[clusterMetrics][containersAllocated]}"
      "containersReserved" => "%{[clusterMetrics][containersReserved]}"
      "containersPending" => "%{[clusterMetrics][containersPending]}"
      "totalMB" => "%{[clusterMetrics][totalMB]}"
      "totalVirtualCores" => "%{[clusterMetrics][totalVirtualCores]}"
      "totalNodes" => "%{[clusterMetrics][totalNodes]}"
      "lostNodes" => "%{[clusterMetrics][lostNodes]}"
      "unhealthyNodes" => "%{[clusterMetrics][unhealthyNodes]}"
      "decommissionedNodes" => "%{[clusterMetrics][decommissionedNodes]}"
      "rebootedNodes" => "%{[clusterMetrics][rebootedNodes]}"
      "activeNodes" => "%{[clusterMetrics][activeNodes]}"
    }
    convert => {
      "appsSubmitted" => "integer"
      "appsCompleted" => "integer"
      "appsPending" => "integer"
      "appsRunning" => "integer"
      "appsFailed" => "integer"
      "appsKilled" => "integer"
      "reservedMB" => "integer"
      "availableMB" => "integer"
      "allocatedMB" => "integer"
      "reservedVirtualCores" => "integer"
      "availableVirtualCores" => "integer"
      "allocatedVirtualCores" => "integer"
      "containersAllocated" => "integer"
      "containersReserved" => "integer"
      "containersPending" => "integer"
      "totalMB" => "integer"
      "totalVirtualCores" => "integer"
      "totalNodes" => "integer"
      "lostNodes" => "integer"
      "unhealthyNodes" => "integer"
      "decommissionedNodes" => "integer"
      "rebootedNodes" => "integer"
      "activeNodes" => "integer"
    }
    remove_field => ["message", "clusterMetrics", "path"]
  }
#  ruby {
#    code => "event.set(\'@timestamp\', LogStash::Timestamp.at(event.get(\'currentTime\') + 28800))"
#  }
  date {
    match => [ "currentTime","UNIX"]
    target => "@timestamp"
  }
}
app:input json
input {
  file {
    path => "/tmp/apps.log"
    codec => "json"
  }
}
filter {
#  ruby {
#    code => "event.set(\'@timestamp\', LogStash::Timestamp.at(event.get(\'currentTime\') + 28800))"
#  }
  date {
    match => [ "currentTime","UNIX"]
    target => "@timestamp"
  }
}
注意:
date插件得到的timestamp为UTC时区,
1)如果是存放到elasticsearch然后用kibana展示(kibana会自动根据浏览器时区做偏移),直接使用UTC时区就可以;
2)如果是存放到其他存储,想直接存储当前时区的时间,需要指定timezone,但是date插件使用UNIX格式时timezone不会生效,会使用系统默认时区,所以使用ruby插件转换时区;
Unix timestamps (i.e. seconds since the epoch) are by definition always UTC and @timestamp is also always UTC. The timezone option indicates the timezone of the source timestamp, but doesn\'t really apply when the UNIX or UNIX_MS patterns are used.
所有timezone:http://joda-time.sourceforge.net/timezones.html
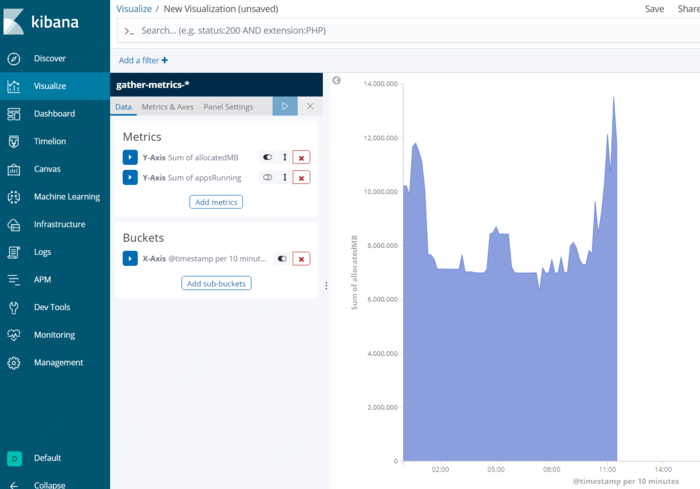
Kibana展示示例
参考:
https://hadoop.apache.org/docs/r2.7.3/hadoop-yarn/hadoop-yarn-site/ResourceManagerRest.html
https://discuss.elastic.co/t/new-timestamp-using-dynamic-timezone-not-working/97166


 京公网安备 11010802041100号