作者:浪费小创_512 | 来源:互联网 | 2023-07-09 18:52
Loki介绍简介LikePrometheus,butforlog.GrafanaLoki是Grafana针对日志相关功能开发的组件。说到日志,就不得不提到ELK。这一套下来,成本还
Loki介绍
简介
Like Prometheus, but for log.

Grafana Loki是Grafana针对日志相关功能开发的组件。说到日志,就不得不提到ELK。这一套下来,成本还是蛮大的。它会引入较多的维护量。
Loki仅索引关于日志的元数据,例如:日志文件的位置、配置等。而日志数据本身并不会进行索引处理。而这些元数据用Label来标识,就像Prometheus一样。日志数据本身被压缩存储在对象存储、或者本地文件系统中。因为仅索引元数据以及采用高度文件压缩方式,Loki非常地轻量级,使用成本也很低。
Loki架构
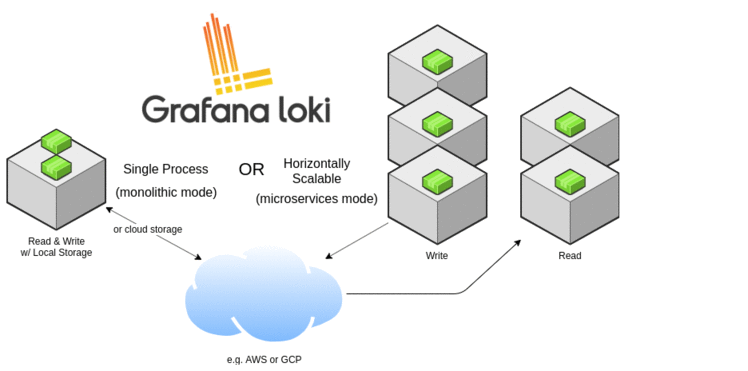
上图表名了,Grafana loki有两种运行模式:
- 单进程模式
- 横向扩展模式
我们需要Loki中的有以下重要组件
- Distributor
- Ingester
- [可选] Query frontend
- Querier
- Chunk Store
Distributor(分发器)
Distributor负责处理客户端请求,也就是将日志数据写入到指定路径之前,先要经过Distributor。Distributor会验证客户端输入流的合法性和正确性,确保传入的用户是合法的租户。然后将每一个chunk(块)拆分成多个批次,并行发送到多个ingester(摄取器中)
Ingester(摄取器)
Ingester摄取器负责将接收到的日志数据写入到 Storage Backend中(可以是S3、Cassandra或者本地文件系统中),并负责将日志数据读取到内存中供外部查询。
[可选]Query fronted(查询前端)
查询前端是可选的组件,它提供了一个日志数据查询的API端口。如果Loki部署了Query fronted组件,那么客户端会将查询发送给Query fronted,而不发给Querier(查询器)。而查询前端还是要将查询交给Querier(查询器)执行查询的。
Querier(查询器)
Querier组件用于接收LogQL语言进行日志数据查询,它会同时从Ingester组件以及后端存储中查询日志。
Chunk Store(块存储)
Chunk Store是用于长期存储Loki日志的存储,并要求块存储能够支持交互式查询和持续写入。Loki支持的chunk store有:
- Amazon DynamoDB
- Google BigTable
- Apache Cassandra
- Amazon S3
- Google Cloud Storage
Chunk Store并不是单独的服务,而是以库的形式提供(在Ingester和Querier使用到)。
读写流程
读流程
Querier接收HTTP查询请求
Querier将查询传递给Ingester组件,并先在内存中查询日志数据
- 如果找到,Ingester返回数据给Querier
- 如果没有找到,Querier将会从Chunk Storage中加载数据并返回
Querier对重复数据进行过滤处理。
写流程
- Distributor接收HTTP写数据请求,并将写数据流发送到对应的Ingester组件、以及对应的副本组件。
- Ingester将接收到日志数据创建一个新的chunk或者增加到现有的chunk中。
- Distributor返回ACK。
安装Loki
要安装Loki,必须要同时安装Promtail以及Loki。
- Loki是一个日志处理引擎
- Promtail将日志发送到Loki
下载Promtail和Loki
https://github.com/grafana/loki/releases/
下载V1.6.1版本
创建Loki用户
useradd loki
passwd loki
上传并解压
[loki@ha-node1 ~]$ ll
总用量 16224
-rw-r--r-- 1 loki loki 16612734 3月  11 11:39 loki-linux-amd64.zip
mkdir /opt/loki
unzip loki-linux-amd64.zip -d /opt/loki
loki-local-config.yaml配置文件
vim /opt/loki/loki-local-config.yaml
auth_enabled: false
server:
  http_listen_port: 3100
  grpc_listen_port: 9096
ingester:
  lifecycler:
    address: ha-node1
    ring:
      kvstore:
        store: inmemory
      replication_factor: 1
    final_sleep: 0s
  chunk_idle_period: 1h       # Any chunk not receiving new logs in this time will be flushed
  max_chunk_age: 1h           # All chunks will be flushed when they hit this age, default is 1h
  chunk_target_size: 1048576  # Loki will attempt to build chunks up to 1.5MB, flushing first if chunk_idle_period or max_chunk_age is reached first
  chunk_retain_period: 30s    # Must be greater than index read cache TTL if using an index cache (Default index read cache TTL is 5m)
  max_transfer_retries: 0     # Chunk transfers disabled
schema_config:
  configs:
    - from: 2020-03-01
      store: boltdb-shipper
      object_store: filesystem
      schema: v11
      index:
        prefix: index_
        period: 24h
storage_config:
  boltdb_shipper:
    active_index_directory: /data/loki/boltdb-shipper-active
    cache_location: /data/loki/boltdb-shipper-cache
    cache_ttl: 24h         # Can be increased for faster performance over longer query periods, uses more disk space
    shared_store: filesystem
  filesystem:
    directory: /data/loki/chunks
limits_config:
  ingestion_rate_mb: 4000
  reject_old_samples: true
  reject_old_samples_max_age: 168h
chunk_store_config:
  max_look_back_period: 0s
table_manager:
  retention_deletes_enabled: true
  retention_period: 720h
配置文件请参考:
https://grafana.com/docs/loki/latest/configuration/#configuration-file-reference
运行Loki
su loki
mkdir -p /opt/loki/logs
nohup /opt/loki/loki-linux-amd64 -config.file=/opt/loki/loki-local-config.yaml >> /opt/loki/logs/$(groups)-$(whoami)-loki-$(hostname).log 2>&1 &
查看Loki
http://ha-node1:3100/metrics
配置节点日志采集
创建日志采集用户
ssh ha-node1 "adduser -g hadoop promtail"; \
ssh ha-node2 "adduser -g hadoop promtail"; \
ssh ha-node3 "adduser -g hadoop promtail"; \
ssh ha-node4 "adduser -g hadoop promtail"; \
ssh ha-node5 "adduser -g hadoop promtail"
上传并解压
su promtail
[promtail@ha-node1 ~]$ ll
总用量 18244
-rw-r--r-- 1 promtail hadoop 18679510 3月  11 11:39 promtail-linux-amd64.zip
mkdir -p /opt/promtail
# 解压
unzip promtail-linux-amd64.zip -d /opt/promtail
配置
以下是一份配置模板:
server:
  http_listen_port: 9080
  grpc_listen_port: 0
positions:
  filename: /tmp/positions.yaml
clients:
  - url: http://localhost:3100/loki/api/v1/push
scrape_configs:
- job_name: system
  static_configs:
  - targets:
      - localhost
    labels:
      job: varlogs
      __path__: /var/log/*log
其中,scrape_configs中配置将指定目录的日志发送到 http://localhost:3100/metrics。配置说明如下:
# 从不同的组中采集日志
- job_name: hadoop
  static_configs:
  # 可选的
  - targets:
      - hdfs
    # 自定义标签(job是一个自定义标签,比较好的是环境名称、JOB名称、或者应用名称
    labels:
      cluster: hdfs
      service: namenode
      instance: hadoop1
      job: hadoop
      # 配置要将什么位置的日志发送到Loki
      __path__: "C:/Program Files/GrafanaLabs/grafana/data/log/grafana.log"
在节点配置如下
vim /opt/promtail/promtail-local-config.yaml
server:
  http_listen_port: 9080
  grpc_listen_port: 0
positions:
  filename: /opt/promtail/positions.yaml
clients:
  - url: http://ha-node1:3100/loki/api/v1/push
scrape_configs:
- job_name: prometail-ha-node1
  static_configs:
  - targets:
      - localhost
    labels:
      cluster: hdfs
      service: namenode
      __path__: /opt/hadoop/logs/*-hdfs-namenode-*.log
  - targets:	# hadoop(hdfs)
      - localhost
    labels:
      cluster: hdfs
      service: datanode
      __path__: /opt/hadoop/logs/*-hdfs-datanode-*.log
  - targets:
      - localhost
    labels:
      cluster: hdfs
      service: zkfc
      __path__: /opt/hadoop/logs/*-hdfs-zkfc-*.log
  - targets:
      - localhost
    labels:
      cluster: hdfs
      service: journalnode
      __path__: /opt/hadoop/logs/*-hdfs-journalnode-*.log
  - targets:
      - localhost
    labels:
      cluster: hdfs
      service: httpfs
      __path__: /opt/hadoop/logs/*-hdfs-httpfs-*.log
  - targets:	# hadoop(yarn)
      - localhost
    labels:
      cluster: yarn
      service: historyserver
      __path__: /opt/hadoop/logs/*-yarn-historyserver-*.log
  - targets:
      - localhost
    labels:
      cluster: yarn
      service: resourcemanager
      __path__: /opt/hadoop/logs/*-yarn-resourcemanager-*.log
  - targets:
      - localhost
    labels:
      cluster: yarn
      service: nodemanager
      __path__: /opt/hadoop/logs/*-yarn-nodemanager-*.log
  - targets:	# zookeeper
      - localhost
    labels:
      cluster: zookeeper
      service: zookeeper
      __path__: /opt/zookeeper/logs/*-zookeeper-server-*.out
  - targets:	# hive
      - localhost
    labels:
      cluster: hive
      service: hive
      __path__: /opt/hive/logs/hive.log.*
  - targets:	# hbase
      - localhost
    labels:
      cluster: hbase
      service: master
      __path__: /opt/hbase/logs/*-hbase-master-*.log
  - targets:
      - localhost
    labels:
      cluster: hbase
      service: regionserver
      __path__: /opt/hbase/logs/*-hbase-regionserver-*.log
  - targets:	# spark
      - localhost
    labels:
      cluster: spark
      service: historyserver
      __path__: /opt/spark/logs/*-spark-org.apache.spark.deploy.history.HistoryServer-*.out
  - targets:
      - localhost
    labels:
      cluster: spark
      service: thriftserver
      __path__: /opt/spark/logs/*-spark-org.apache.spark.sql.hive.thriftserver.HiveThriftServer2*.out
  - targets:	# loki
      - localhost
    labels:
      cluster: loki
      service: loki
      __path__: /opt/loki/logs/*-loki-*.log
  - targets:	# promtail
      - localhost
    labels:
      cluster: promtail
      service: promtail
      __path__: /opt/promtail/logs/*-promtail-*.log
创建日志目录
ssh ha-node1 "su - promtail -c 'mkdir -p /opt/promtail/logs'"; \
ssh ha-node1 "su - promtail -c 'mkdir -p /opt/promtail/logs'"; \
ssh ha-node1 "su - promtail -c 'mkdir -p /opt/promtail/logs'"; \
ssh ha-node1 "su - promtail -c 'mkdir -p /opt/promtail/logs'"; \
ssh ha-node1 "su - promtail -c 'mkdir -p /opt/promtail/logs'"
分发到所有节点
scp -r /opt/promtail ha-node1:/opt; \
scp -r /opt/promtail ha-node2:/opt; \
scp -r /opt/promtail ha-node3:/opt; \
scp -r /opt/promtail ha-node4:/opt; \
scp -r /opt/promtail ha-node5:/opt
# 修改目录权限
ssh ha-node2 "chown -R promtail:hadoop /opt/promtail"; \
ssh ha-node3 "chown -R promtail:hadoop /opt/promtail"; \
ssh ha-node4 "chown -R promtail:hadoop /opt/promtail"; \
ssh ha-node5 "chown -R promtail:hadoop /opt/promtail"
配置参考: https://grafana.com/docs/loki/latest/clients/promtail/configuration/
处理特殊日志
需要单独处理spark thrift server以及history server日志,将第一行的执行命令删除。
启动
su promtail
nohup /opt/promtail/promtail-linux-amd64 -config.file=/opt/promtail/promtail-local-config.yaml -client.external-labels=platform=hadoop-ha,host=$(hostname) >> /opt/promtail/logs/$(groups)-$(whoami)-promtail-$(hostname).log 2>&1 &
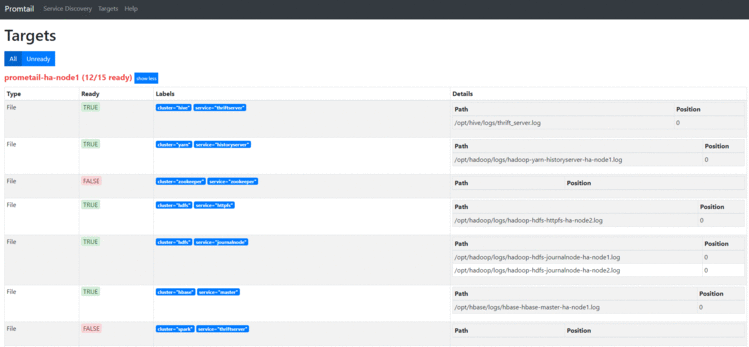
查看promtail webui
http://ha-node1:9080/targets
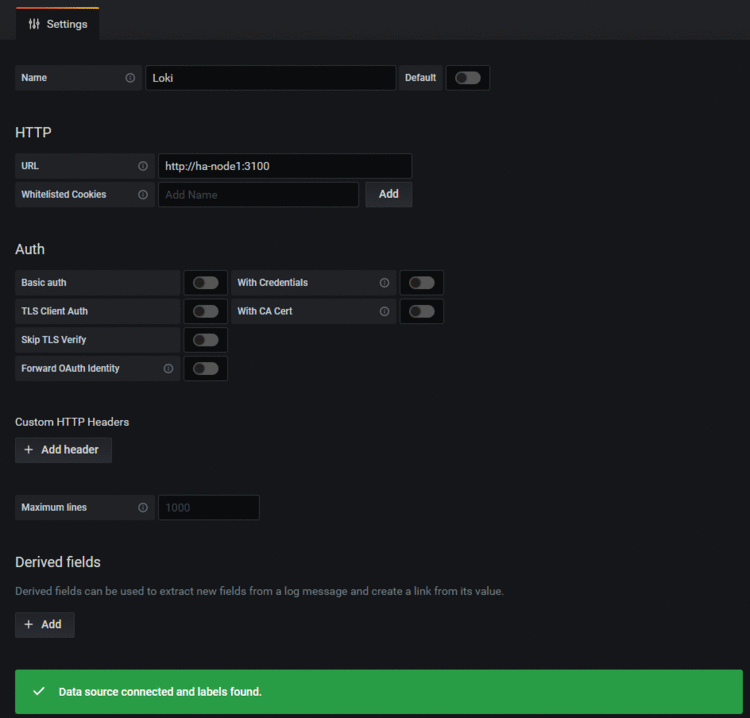
Grafana展示日志
配置Loki数据源
统一日志查询
直接使用Grafana的Explorer功能即可查看日志。
关注公众号大数据君!关注最新的大数据技术动态!


![[ipsec][strongswan]strongswan源码分析(五)plugin的配置文件的添加方法与管理架构解析](https://img2.php1.cn/3cdc5/3909/339/3e35aa3d77315ada.png)


 京公网安备 11010802041100号