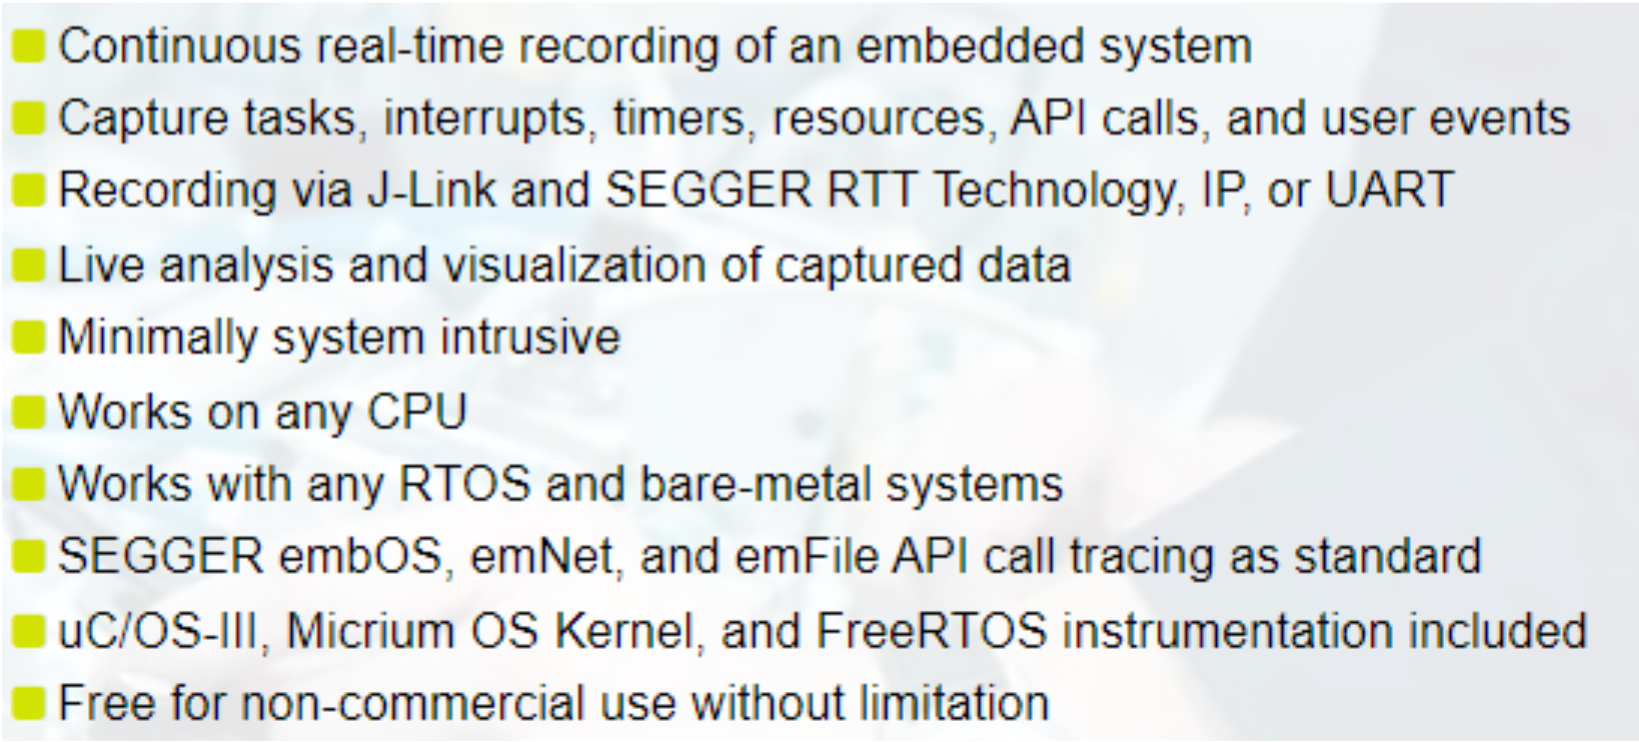
There are no feature limitations with a non-commercial license. SystemView enables unlimited recording and comes with features for better analysis, search, and filtering.
而且,systemview是跨平台的,看看segger的情怀,不仅免费而且跨平台。
2.什么是systemview
SystemView is a toolkit for visual analysis of any embedded system. SystemView gives complete insight into an application, to gain a deep understanding of the runtime behavior, going far beyond what a debugger is offering. This is particularly advantageous when developing and working in complex systems with multiple tasks and events.
SystemView consists of two parts:
• The PC visualization SystemView Application
• Code that gathers telemetry data on the target system.
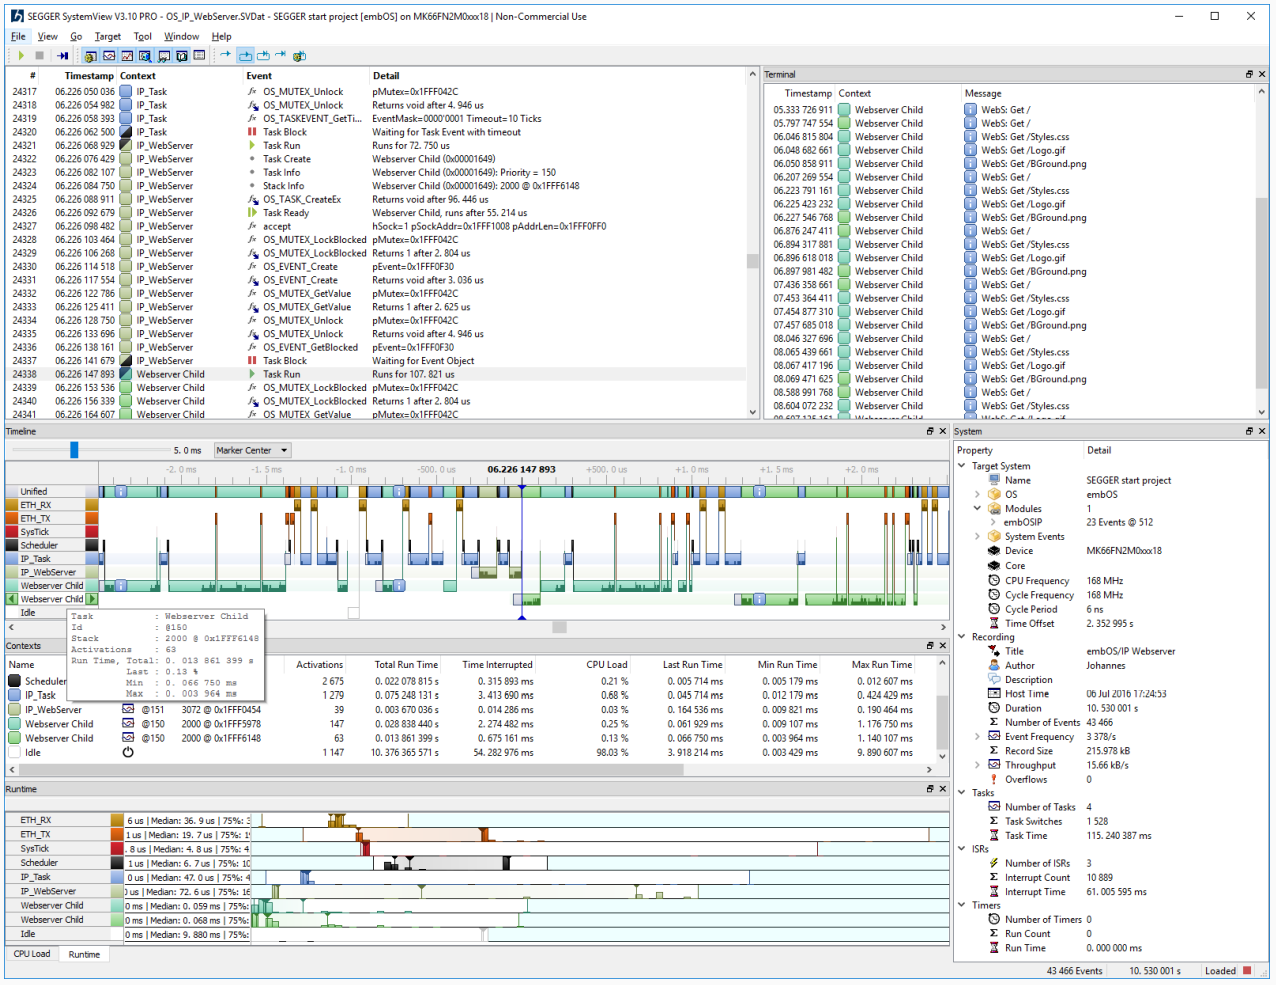
The SystemView application allows analysis and profiling of the behavior of an embedded system. It records the telemetry data generated by the embedded system and visualizes that information in a variety of ways. The recording can be saved to a file for later analysis or for documentation of the system.
The telemtery data is recorded through the debug interface, through a network connection, or over a serial line. When recording through the debug interface, no additional hardware (and additional pinning) is required to use SystemView. It can be used on any system that allows debug access.
With a SEGGER J-Link and its Real Time Transfer (RTT) technology, SystemView can continuously record, analyze, and visualize data in real time.
SystemView makes it possible to analyze which interrupts, tasks, and software timers have executed, how often, when exactly and how much time they have used. It sheds light on what exactly happened, in which order, which interrupt has triggered which task switch, which interrupt and task has called which API function of the underlying modules.
Cycle-accurate profiling can be performed and performance markers can be added in the system to measure timings.
SystemView can be used to verify that the embedded system behaves as expected and can be used to find problems and inefficiencies, such as superfluous and spurious interrupts, unexpected task changes, or badly-chosen task priorities. It can be used with any (RT)OS which is instrumented to call SystemView event functions, but also in systems without an instrumented RTOS or without any RTOS at all, to analyze interrupt execution and to time user functionality like time-critical subroutines.
3.它怎么工作
On the target side a small software module, containing SYSTEMVIEW and RTT, must be included. The SYSTEMVIEW module collects and formats the monitor data and passes it to RTT.
The target system calls SYSTEMVIEW functions in certain situations, such as interrupt start and interrupt end, to monitor events. SystemView stores these events together with a configurable, high-accuracy timestamp. Timestamps can be as accurate as 1 CPU cycle, which equates to 5 ns on a 200 MHz CPU.
The RTT module stores the data in the target buffer, which enables continuous recording, as well as single-shot recording and post-mortem analysis.
The recorder interface reads the data from the RTT buffer and sends it to the SystemView Application.
recorder interface 可以是调试接口、串口、网络。
由此可以看出systemview记录任务的事件是非常精确的。
4.目标板要求
The combined ROM size of RTT and the SYSTEMVIEW modules is less than 2 KByte. For typical systems, about 600 bytes of RAM are sufficient for continuous recording. For system-triggered recording the buffer size is determined by the time to be recorded and the amount of events. No other hardware is required. The CPU requires less than 1 us for typical events (based on a 200 MHz Cortex-M4 CPU), which results in less than 1% overhead in a system with 10,000 events per second. Since the debug interface (JTAG, SWD, FINE, …) is used to transfer the data, no additional pins are required.
我觉得这个要求对于绝绝大部分目标板卡是完全可以满足的。
5.什么cpu可以使用systemview
SystemView can be used on any CPU. Continuous real-time recording can be carried out on any system supported by J-Link RTT technology or using a network connection or serial line. RTT requires the ability to read memory via the debug interface during program execution which is generally supported in ARM Cortex-M0, M0+, M1, M3, M4, M7, M23, M33 processors as well as all Renesas RX devices.
On systems which are not supported by the RTT technology the buffer content can also be read manually through the debug probe when the system is halted, which allows single-shot recording until the buffer is filled and post-mortem analysis to capture the latest recorded data. Single-shot and post-mortem recording can be triggered by the system to be able to control when a recording starts and stops.
所有cpu都可以使用,只是有些cpu不可以用调试接口,原因是不是所有的cpu都集成相应的调试接口模块(RTT requires memory access on the target while the target is running.)


 京公网安备 11010802041100号