基于matplotlib的双Batch带标签bar图生成函数李俊才邮箱:291148484163.com【代码实现】importmatplotlibimpor
基于matplotlib的双Batch带标签bar图生成函数
李俊才
邮箱:291148484@163.com
【代码实现】
import matplotlib
import matplotlib.pyplot as plt
import numpy as npdef barchart_ax_2Batch(title,xlabel,ylabel,batch1_name,batch2_name,x_text,batch1,batch2,background_color,Batch1_color,Batch2_color):plt.rcParams['font.sans-serif'] = ['KaiTi'] x = np.arange(len(x_text))width = 0.35fig, ax = plt.subplots()rects1 = ax.bar(x - width/2, batch1, width, label = batch1_name, color = Batch1_color) rects2 = ax.bar(x + width/2, batch2, width, label = batch2_name, color = Batch2_color) ax.patch.set_facecolor(background_color) ax.set_title(title) ax.set_xlabel(xlabel) ax.set_ylabel(ylabel) ax.set_xticks(x) ax.set_xticklabels(x_text) ax.legend() for rect in rects1:height = rect.get_height()ax.annotate('{}'.format(height), xy=(rect.get_x() + rect.get_width() / 2, height),xytext=(0,3), textcoords="offset points",ha='center', va='bottom')for rect in rects2:height = rect.get_height()ax.annotate('{}'.format(height), xy=(rect.get_x() + rect.get_width() / 2, height),xytext=(0,3), textcoords="offset points",ha='center', va='bottom')plt.grid(linestyle = "dotted",color = "r") fig.tight_layout()plt.show()
【调用实例】
新手调用时,请尽量按照两部走的原则:
- 1.先定义各种待传入函数接口的数据,
- 2.调用函数。
参数很多时不要把所有参数的取值都写到调用函数处,这样将降低可读性。
title = '期末平均考成绩比较图'
xlabel = '科目'
ylabel = '得分'
batch1_name = '高2020-07班'
batch2_name = '高2020-09班'
x_text = ['语文', '数学', '英语', '物理', '化学' ,'生物']
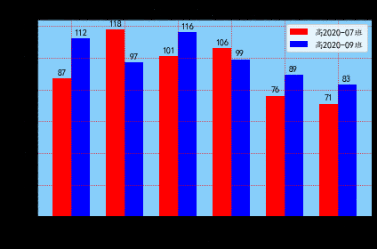
batch1 = [87, 118, 101, 106, 76, 71]
batch2 = [112, 97, 116, 99, 89, 83]
background_color = "lightskyblue"
Batch1_color = "red"
Batch2_color = "blue"
barchart_ax_2Batch(title,xlabel,ylabel,batch1_name,batch2_name,x_text,batch1,batch2,background_color,Batch1_color,Batch2_color)
生成图片效果如下:

内容仅供参考,如需使用请指明出处。
202012.29.更新/回复
【事项记录】:有同学留言,说想要绘制百分比标签的。其实这不难。可以如下思路操作:
- 1.输入数据前先表列表中的数据标准化,即处理成百分数的一百倍。比如百分之97.15%则处理成97.15
- 2.对函数中格式化操作稍微更改。
还是用上面的数据举个栗子吧,假设我们想得到两个班同学各科成绩占满分的占比。
import matplotlib
import matplotlib.pyplot as plt
import seaborn as snsdef bar_2batch( x_labels,y1,y2,title=None,xtitle=None,ytitle=None,legend1=None,legend2=None,background_color="#ffffff",Batch1_color="#5B9BD5",Batch2_color="#ED7D31"):plt.rcParams['font.sans-serif'] = ['KaiTi']pylab.rcParams['figure.figsize'] = (7.0, 4.0)x = np.arange(len(x_labels))width = 0.25fig, ax = plt.subplots()rects1 = ax.bar(x - width/2, y1, width, label = legend1, color = Batch1_color) rects2 = ax.bar(x + width/2, y2, width, label = legend2, color = Batch2_color) ax.patch.set_facecolor(background_color)ax.set_title(title)ax.set_xlabel(xtitle)ax.set_ylabel(ytitle) ax.set_xticks(x) ax.set_xticklabels(x_labels)if (legend1 is not None) or (legend1 is not None): ax.legend()def add_dlb(rects):for rect in rects:height = rect.get_height()ax.annotate('{0:.2f}%'.format(height), xy=(rect.get_x() + rect.get_width() / 2, height),xytext=(0,3), textcoords="offset >points", ha='center', va='bottom')add_dlb(rects1)add_dlb(rects2)plt.grid(linestyle = "-",color = "#DBDBDB") fig.tight_layout()plt.show()
title = '两班学生各科目成绩满分比'
xtitle = '科目'
ytitle = '得分'
legend1 = '高2020-07班'
legend2 = '高2020-09班'
x_labels = ['语文', '数学', '英语', '物理', '化学' ,'生物']
y1 = [87/150*100, 118/150*100, 101/150*100, 96/100*100, 76/100*100, 71/100*100]
y2 = [112/150*100, 97/150*100, 116/150*100, 99/100*100, 89/100*100, 83/100*100]
bar_2batch(x_labels,y1,y2,title=title,legend1=legend1,legend2=legend2)
效果如图所示:

由于定义了默认参数,当不需要要标题等参数的时候,你甚至也可以只给出数据。比如:
bar_2batch(x_labels,y1,y2)
其运行结果为:

20201230 更新日志
顺便补充一点,如果绘制单Batch的,又想使用seaborn主题,还想在jupyter中改变尺寸大小,好。那么一下这个内容适合你。当然多Batch只要将之前的代码同理稍作修改就好了。
直接给出代码吧:
import matplotlib
import matplotlib.pyplot as plt
import numpy as np
import pylab
import seaborn as sns
sns.set(style="darkgrid")def bar_1batch( x_labels,y1,title=None,xtitle=None,ytitle=None,legend1=None,Batch1_color="#5B9BD5"):plt.rcParams['font.sans-serif'] = ['KaiTi'] x = np.arange(len(x_labels))width = 0.75fig, ax = plt.subplots()rects1 = ax.bar(x - width/2, y1, width, label = legend1, color = Batch1_color)if legend1 != None:ax.legend() ax.set_title(title) ax.set_xlabel(xtitle) ax.set_ylabel(ytitle) ax.set_xticks(x) ax.set_xticklabels(x_labels) pylab.rcParams['figure.figsize'] = (16.0, 5.0)plt.rcParams['font.sans-serif'] = ['KaiTi']matplotlib.rcParams['axes.unicode_minus'] = Falsedef add_dlb(rects):for rect in rects:height = rect.get_height()ax.annotate('{}'.format(height), xy=(rect.get_x() + rect.get_width() / 2, height),xytext=(0,3), textcoords="offset points", ha='center', va='bottom')add_dlb(rects1)plt.grid(linestyle = "-",color = "#DBDBDB")fig.tight_layout()plt.show()
n=36
x_labels = [str(i) for i in range(n)]
y1 = np.random.randint(10,90,size=(1,n),dtype=int)[0]
bar_1batch(x_labels,y1)
在jupyter中运行结果如下图所示:

这样就控制图像的大小让我们看起来更“爽”。