haproxy prometheus 的监控metrics 使用的是exporter ,因为haproxy 对于状态统计报告处理的 比较好,我们可以了stats 同时支持一个csv的api 接口,所以exporter也是基于这个搞的开发,同时 里面对于不同版本的haproxy 做了适配
version: "3"
services:
haproxy:
image: haproxy:1.7
ports:
- "5000:5000"
- "10080:10080"
volumes:
- "./conf/haproxy:/usr/local/etc/haproxy:ro"
exporter:
image: quay.io/prometheus/haproxy-exporter:v0.9.0
command: --haproxy.scrape-uri="http://admin:password@haproxy:10080/haproxy?stats;csv"
- "9101:9101"
g:
image: grafana/grafana
- "3000:3000"
p:
image: prom/prometheus
- "./conf/prometheus.yml:/etc/prometheus/prometheus.yml"
- "9090:9090"
global
log 127.0.0.1 local2
maxconn 4000
# turn on stats unix socket
#---------------------------------------------------------------------
# common defaults that all the 'listen' and 'backend' sections will
# use if not designated in their block
defaults
mode http
log global
option httplog
option dontlognull
option http-server-close
option forwardfor except 127.0.0.0/8
option redispatch
retries 3
timeout http-request 10s
timeout queue 1m
timeout connect 10s
timeout client 1m
timeout server 1m
timeout http-keep-alive 10s
timeout check 10s
maxconn 3000
# main frontend which proxys to the backends
frontend main
bind 0.0.0.0:5000
default_backend app
backend app
balance roundrobin
server app1 10.15.0.80:80 check
server app2 10.15.0.80:8080 check
server app3 127.0.0.1:5003 check
server app4 127.0.0.1:5004 check
listen stats
bind 0.0.0.0:10080
maxconn 10
clitimeout 100s
srvtimeout 100s
contimeout 100s
timeout queue 100s
stats enable
stats hide-version
stats refresh 30s
stats show-node
stats auth admin:password
stats uri /haproxy?stats
scrape_configs:
- job_name: haproxy
metrics_path: /metrics
static_configs:
- targets: ['exporter:9101']
docker-compose up -d
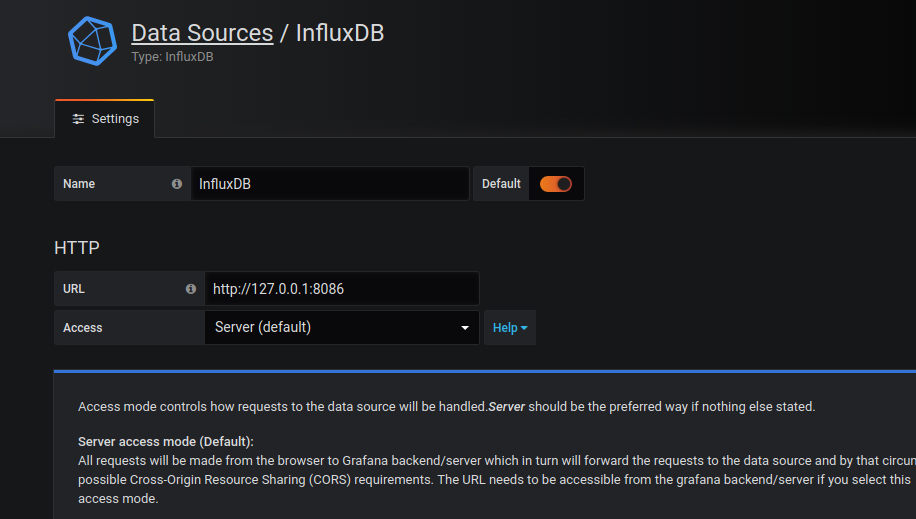
docker-compose文件同时集成了grafana,可以方便的进行UI的可视化展示
https://github.com/rongfengliang/haproxy_promethues-docker-compose https://github.com/prometheus/haproxy_exporter https://hub.docker.com/_/haproxy


![[软件工具]最新最好最全的软件大全一起打包下载了[永远留种]](https://img.php1.cn/3cd4a/1e618/bdf/129913486c37ddf6.jpeg)


 京公网安备 11010802041100号