作者:518094haha | 来源:互联网 | 2023-06-30 13:42
excel文字显示图标集SeehowtocreateyourownExceliconset,toovercomealimitationwiththebuilt-inoptions.
excel文字显示图标集
See how to create your own Excel icon set, to overcome a limitation with the built-in options. Icon Sets were added to conditional formatting in Excel 2007, and you can use the icons to highlight the results in a group of cells. This workaround uses symbols on the worksheet, instead of the Icon Set symbols.
了解如何创建自己的Excel图标集,以克服内置选项的限制。 图标集已添加到Excel 2007中的条件格式中,您可以使用图标突出显示一组单元格中的结果。 此替代方法使用工作表上的符号,而不是图标集符号。
图标集示例 (Icon Set Example)
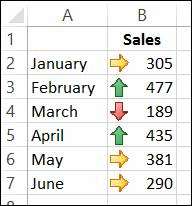
In this Icon Set example, higher sales numbers show a green up arrow.
在此“图标集”示例中,较高的销售数字显示绿色的向上箭头。

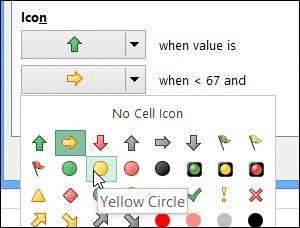
This feature was improved in Excel 2010, and now you can customize these sets, creating your own mix from the existing icons.
Excel 2010中对此功能进行了改进,现在您可以自定义这些集合,并根据现有图标创建自己的组合。

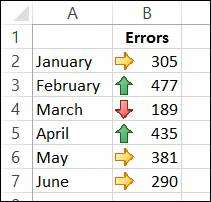
What happens if those numbers represent errors, instead of sales? Now the lower numbers are better, so the higher numbers should show a red up arrow. Unfortunately, you can’t change the color of the icons. If you want a red Up Arrow, instead of green, you’re out of luck!
如果这些数字代表错误而不是销售,该怎么办? 现在,数字越小越好,因此数字越大,应该显示红色的向上箭头。 不幸的是,您无法更改图标的颜色。 如果您想要红色的向上箭头,而不是绿色,那您就不走运了!

创建自己的图标 (Create Your Own Icons)
If you can’t find the icons that you need, you can create your own set. Set up a lookup table with the values and symbols for your formatting rules. Then, add a formula and formatting in an adjacent cell, to show the applicable icon.
如果找不到所需的图标,则可以创建自己的图标集。 使用格式规则的值和符号设置查找表。 然后,在相邻的单元格中添加公式并设置格式,以显示适用的图标。
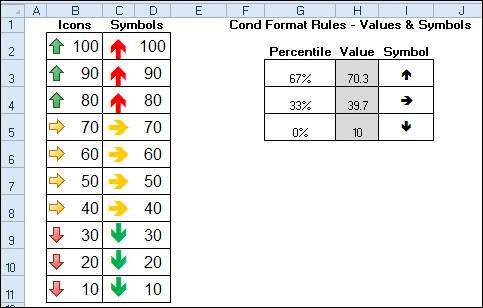
In the screen shot below, column B shows the built-in icons, for numbers 10 to 100. In column C, you can see the symbols that were created – a red up arrow for high numbers and green down arrow for low numbers.
在下面的屏幕快照中,B列显示了内置图标,表示10到100的数字。在C列中,您可以看到创建的符号-红色的向上箭头代表高数字,绿色的向下箭头代表低数字。

创建查找表 (Create the Lookup Table)
First, set up the lookup table
首先,设置查找表
- In G3:G5, type the percentages: 67%, 33%, 0%
在G3:G5中,输入百分比:67%,33%,0%
- In H3, enter the formula: =PERCENTILE($D$2:$D$11,G3)
在H3中,输入公式:= PERCENTILE($ D $ 2:$ D $ 11,G3)
- Copy the formula down to rows 4 and 5
将公式复制到第4和5行
- Format cells H3:H5 in Wingding3 font
使用Wingding3字体设置单元格H3:H5的格式
- Use Excel’s Insert Symbols feature to add the up, right, and down arrows in those cells, from the Wingdings 3 font.
使用Excel的“插入符号”功能从Wingdings 3字体在这些单元格中添加向上,向右和向下箭头。
添加自定义图标 (Add the Custom Icons)
Next, create the icons in column C:
接下来,在列C中创建图标:
In cell C2 enter the formula that creates the icon:
在单元格C2中,输入创建图标的公式:
=IF(D2=””,””,IF(D2>=$H$3,$I$3,IF(D2>=$H$4,$I$4,$I$5)))
= IF(D2 =“”,“”,IF(D2> = $ H $ 3,$ I $ 3,IF(D2> = $ H $ 4,$ I $ 4,$ I $ 5)))
- Copy the formula down to cell C11
将公式复制到单元格C11
- Format cells C2:C11 with Wingding3 font, and yellow font color
使用Wingding3字体和黄色字体颜色设置单元格C2:C11的格式
- Select cells C2:C11
选择单元格C2:C11
- On the Ribbon’s Home tab, click Conditional Formatting, then click New Rule
在功能区的“主页”选项卡上,单击“条件格式”,然后单击“新规则”。
Click Use a Formula to Determine Which Cells to Format
单击“ 使用公式来确定要格式化的单元格”
For the formula, enter: =$B2<$H$4
对于公式,输入: = $ B2 <$ H $ 4
- Click the Format button, and select Green as the font colour, then click OK.
单击格式按钮,然后选择绿色作为字体颜色,然后单击确定。
Click New Rule, and click Use a Formula to Determine Which Cells to Format
单击新建规则,然后单击使用公式来确定要格式化的单元格
For the formula,enter: =$B2>$H$3
对于公式,输入: = $ B2> $ H $ 3
- Click the Format button, and select Red as the font colour, then click OK.
单击格式按钮,然后选择红色作为字体颜色,然后单击确定。
- Click OK
点击确定
- To make the icons appear to be in the same cell as the number, you can create an outside border around the two cells.
要使图标看起来与数字位于同一单元格中,可以在两个单元格之间创建外边框。
下载样本文件 (Download the Sample File)
To download the sample file, please visit the Conditional Formatting Examples page on my Contextures website.
要下载示例文件,请访问我的Contextures网站上的“ 条件格式示例”页面。
This example is in the 2010/2007 version of the download file.
此示例位于下载文件的2010/2007版本中。
翻译自: https://contexturesblog.com/archives/2013/09/03/create-your-own-excel-icon-set/
excel文字显示图标集