作者:风一样的男孩668 | 来源:互联网 | 2023-06-11 11:34
第一步:被监控客户端准备工作Nginx要支持stub_status_module选项,用以下命令来验证确认:#nginx-V2&1|grep-owith-http_stub_st
第一步:被监控客户端准备工作
Nginx要支持stub_status_module选项,用以下命令来验证确认:
# nginx -V 2>&1 | grep -o with-http_stub_status_module
with-http_stub_status_module
Nginx配置文件添加以下配置:
location /ngx_status {
stub_status on;
access_log off;
allow 127.0.0.1;
deny all;
}
使用Curl请求一下:
# curl http://127.0.0.1/ngx_status
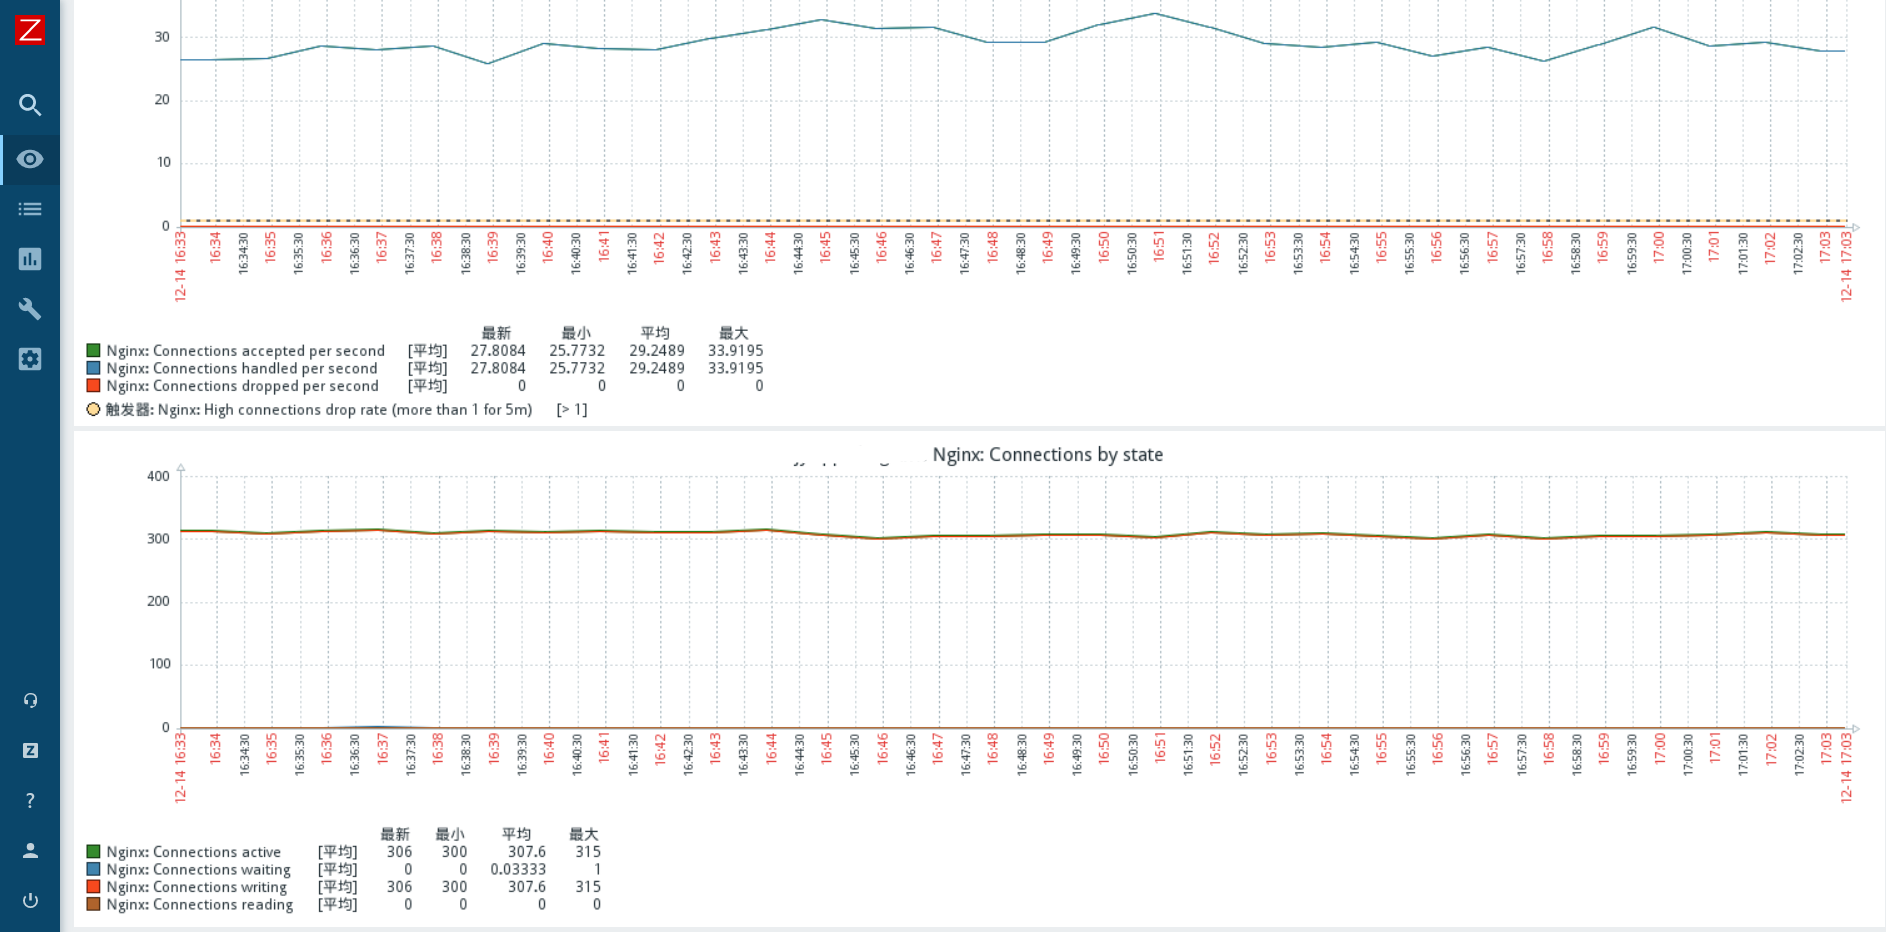
Active connections: 315
server accepts handled requests
97113763 97113763 89107865
Reading: 0 Writing: 315 Waiting: 0
第二步:监控系统服务端准备工作
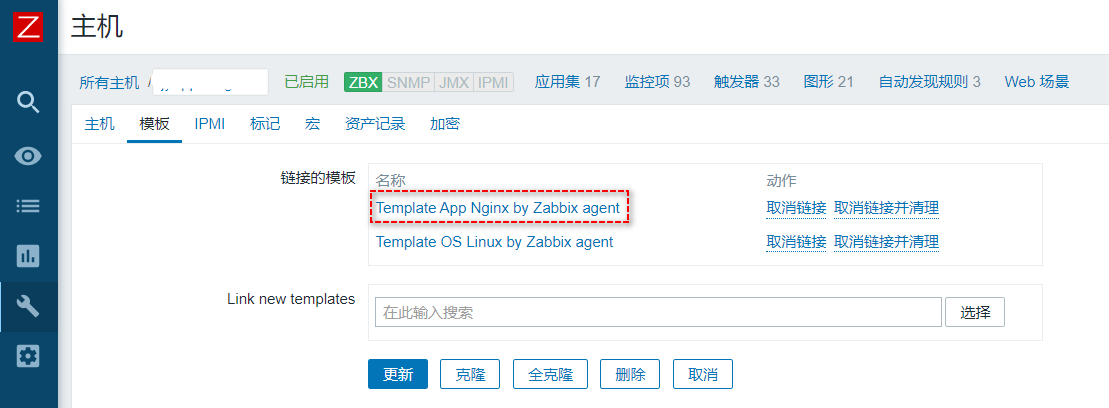
找到对应主机,链接Zabbix自带的Nginx模板
过了一会儿,发现该模板的某些图形没出数据。于是,上官网查看文档。
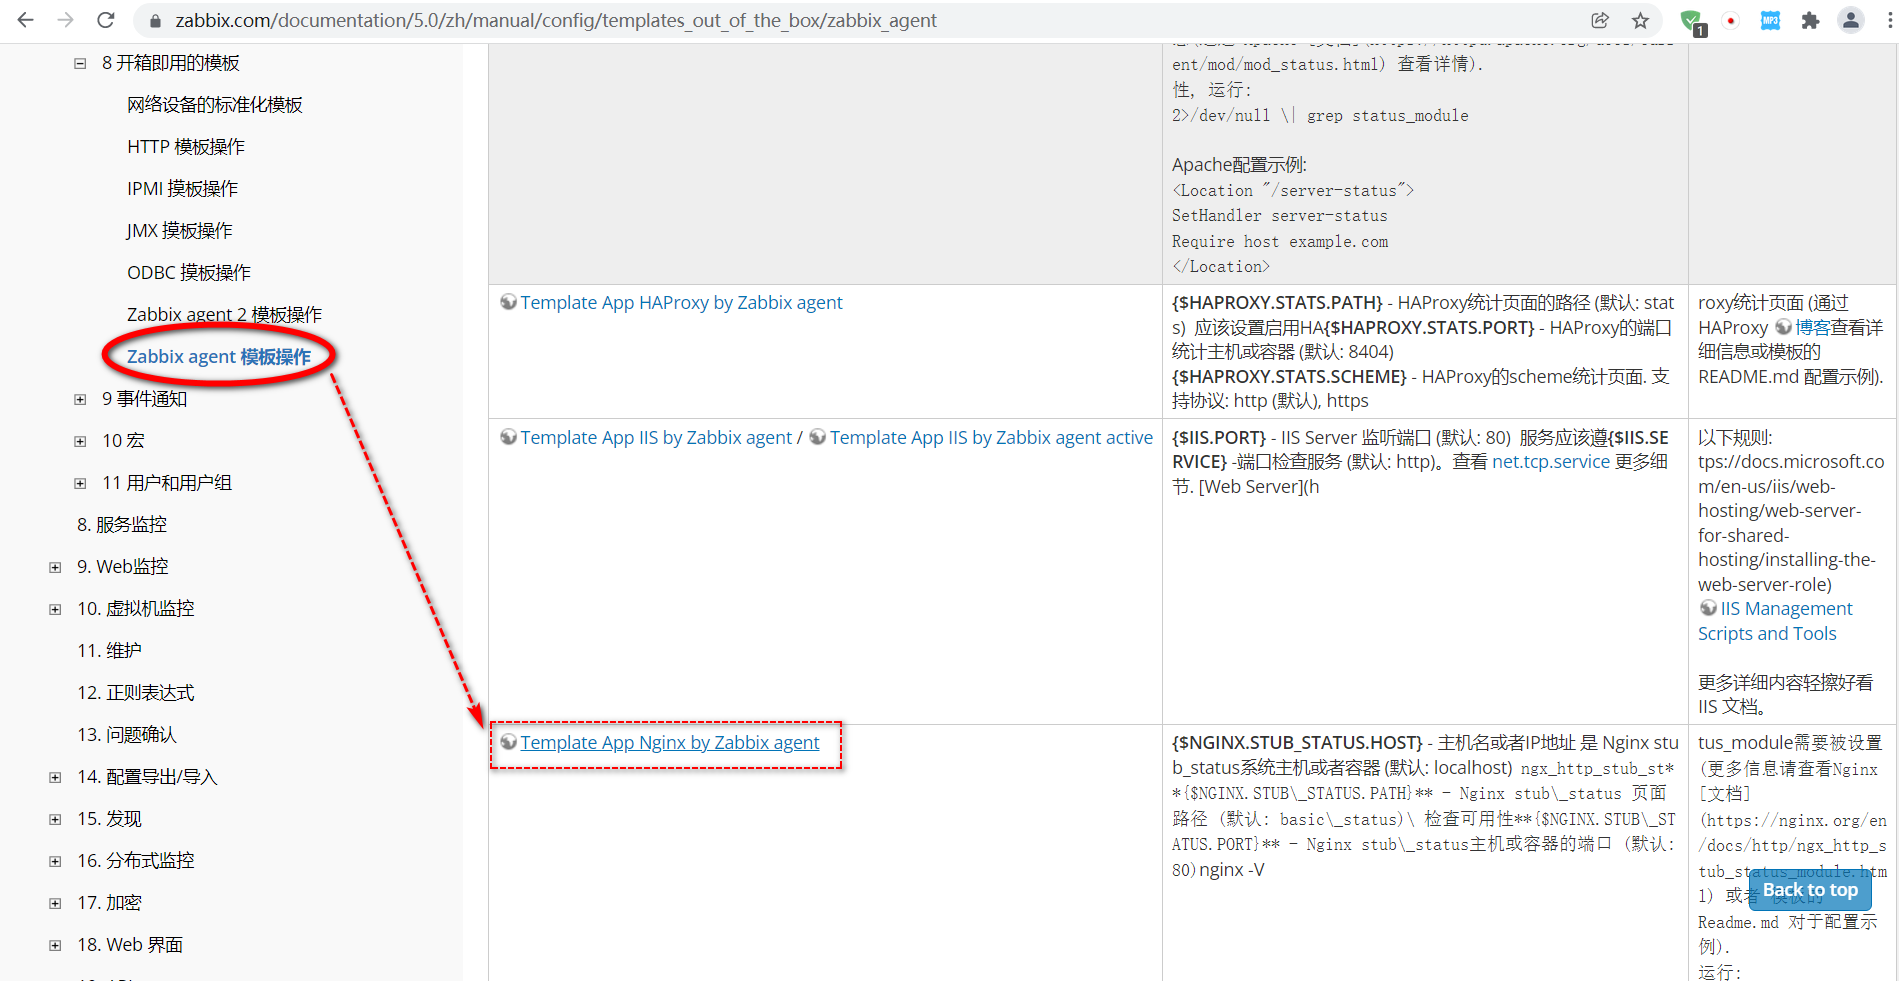
这里有该模板的相关介绍说明。也许可以找到问题所在。
官网文档地址:https://www.zabbix.com/documentation/5.0/zh/manual/config/templates_out_of_the_box/zabbix_agent
点进去看看说明:
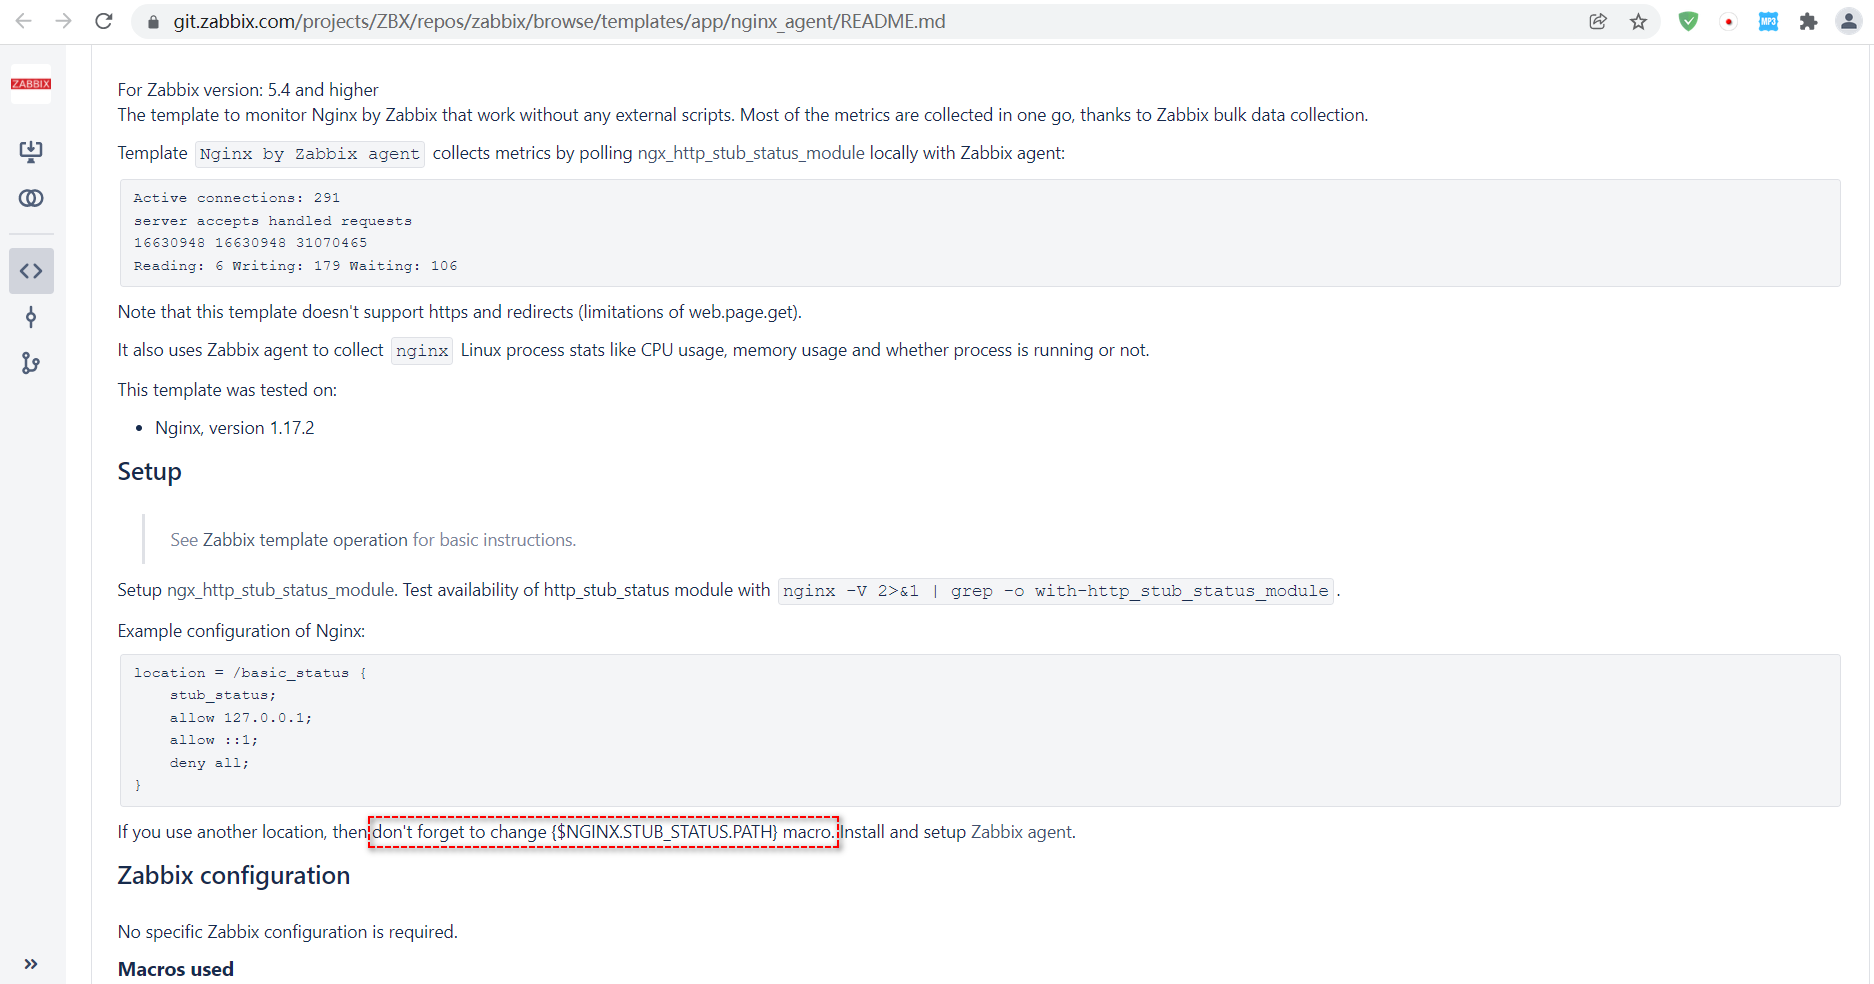
可以看到他默认的Nginx stub_status path是basic_status,也许问题就在这里。回到监控系统,找到该值的设置地方,修改一下。
配置-->模板-->Template App Nginx by Zabbix agent
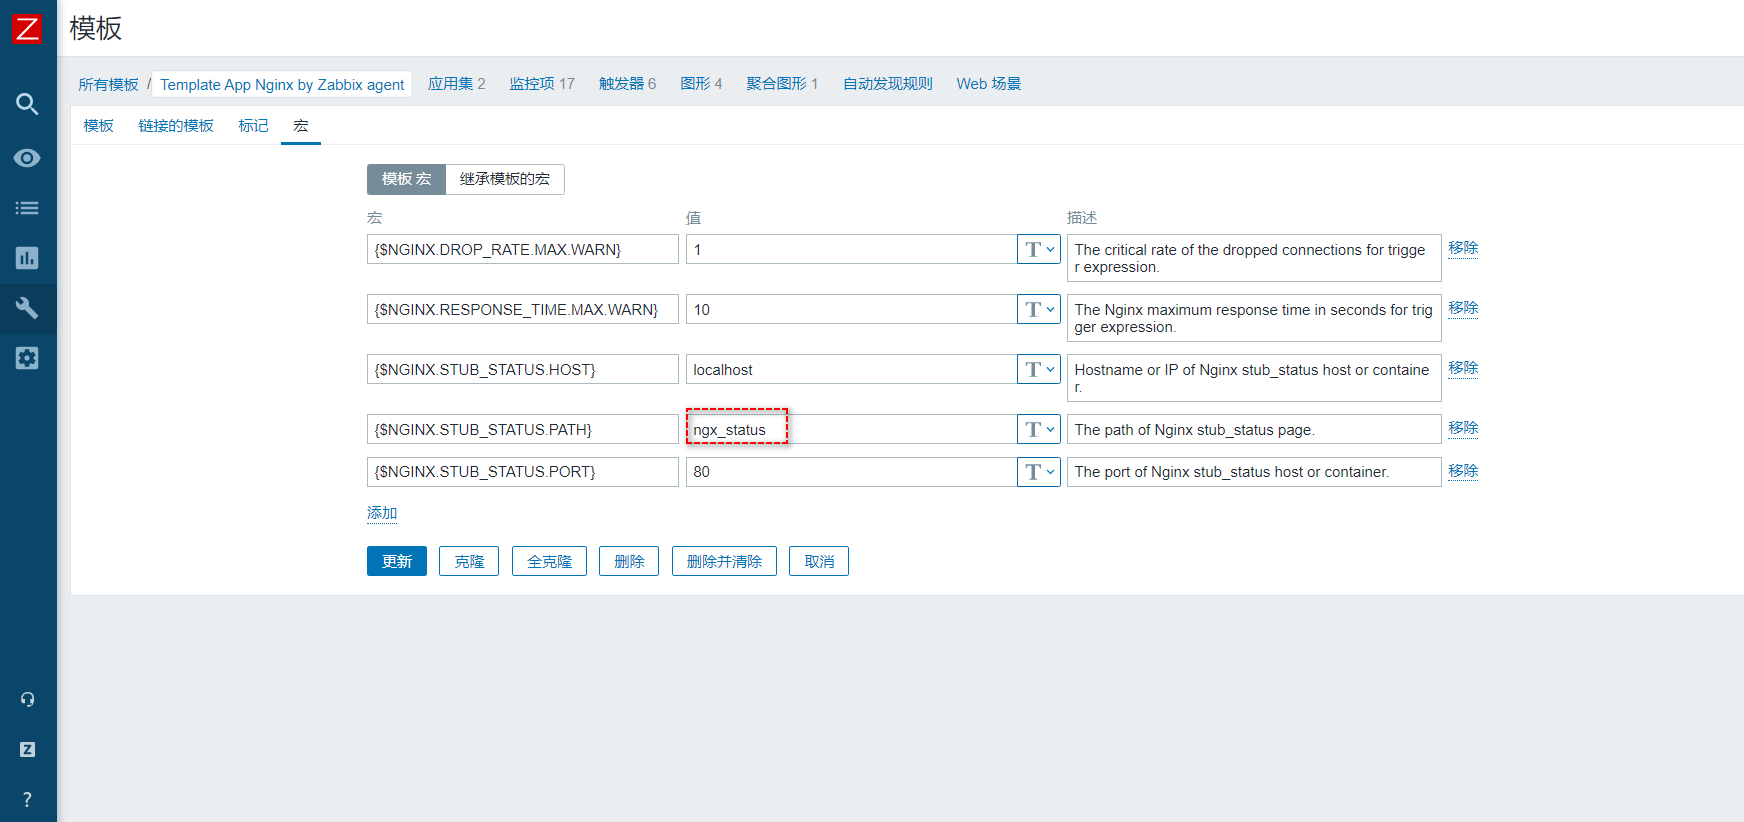
NGINX.STUB_STATUS.PATH的默认值是basic_status,将其修改为你nginx的配置文件里设置的名称。更新。一会就可以看到图形出来数据了。


 京公网安备 11010802041100号