作者:何俊雨_127 | 来源:互联网 | 2022-11-26 12:51
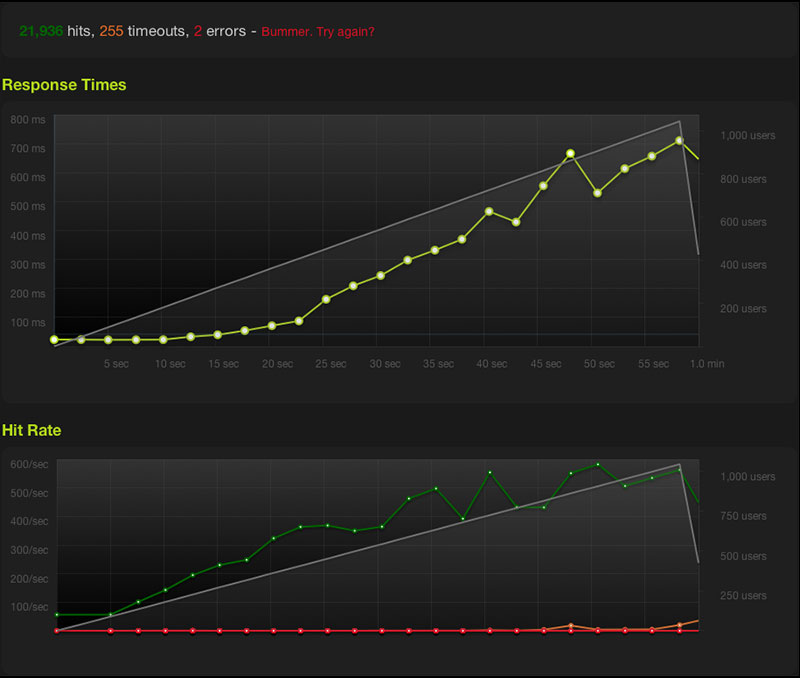
我需要在我的bar图表上添加一个简单的点/垂直线,它具有动态X值,0表示Y值.预览我需要的东西(红点):

绿色值是动态的.
预览我目前的状态:

其中3.30应该是点的X坐标 - [3.30,0].
我使用Vue的图表的图表和我尝试做创建一个混合的一个与bar和scatter,但scatter需要type: 'linear'为它的xAxis不适合我的需要的bar图表.
所以我尝试使用chartjs-plugin-annotation,它的box类型接受"坐标"但这里的问题是该X值必须是X轴(labels对象)上的固定值.如果我放置X轴[3,0]它将起作用,但如果有一个十进制数,如[3.5,0],它将无法工作.
  // data
  options: {
    responsive: true,
    maintainAspectRatio: false,
    legend: {
      display: false
    },
    scales: {
      yAxes: [{
        ticks: {
          min: 0,
          max: 1,
          stepSize: 0.1
        }
      }]
    }
  }

  // computed
  labels: [1, 2, 3, 4, 5, 6], // fixed value, there are always 6 bars
  datasets: [
    {
      label: 'Values',
      backgroundColor: '#f89098',
      data: this.tableInputValues // array of decimal values
    }
  ]
所以,我的问题是如何在Chart.js条形图上放置一个"简单"点或垂直线,其中点具有X轴的动态值 - > [动态值,0].
仅供参考 - 它是关于预期价值
1> P3trur0..:
据我所知,Vue Chart使用canvas工作(如Demo页面所示).
因此,我的建议是检索表示DOM中图表的画布节点,并动态编写所需的点.例如:
var c = document.getElementById("bar-chart");   //hereby assuming canvas named "bar-chart"
var ctx = c.getContext("2d");
ctx.fillStyle = "#ff0000";                     //red color for the dot
ctx.beginPath();
let yPosition = c.height - 5;                 //fixed y position
let xPosition = 35;                          //that's the dynamic expected value
ctx.arc(xPosition, yPosition, 2.5, 0, 2 * Math.PI);
ctx.fill();
在这里,您可以找到演示如何使用Vue实现该功能的演示.在这种情况下,您需要包装代码以在afterDraw钩子中的画布上绘制一个点.这个钩子需要作为插件附加到图表组件,所以像这样:
...
mounted () {
   //adding the plugin to draw the red dot
   this.addPlugin({
    id: 'chart-plugin',
    afterDraw: function (chart) {
       var c = chart.canvas;
       var ctx = c.getContext("2d");
       ctx.fillStyle = "#ff0000";
       ctx.beginPath();
       let xPosition = 742; //x positioning to be calculated according to your needs
       let yPosition = c.height - 28;
       ctx.arc(xPosition, yPosition, 3, 0, 2 * Math.PI);
       ctx.fill();
    }
  });

  //actual chart rendering
  this.renderChart({
    ...
  });
}
...
为了完整起见,您可以在此找到Chart.js插件API的所有可用挂钩列表.
Tnx的更新,我会在测试时通知您.


 京公网安备 11010802041100号