进群:548377875即可获取数十套PDF哦!是分开私信哦!
现在我们看看digits数据集统计性信息
#一共有1797个数据和1797标签
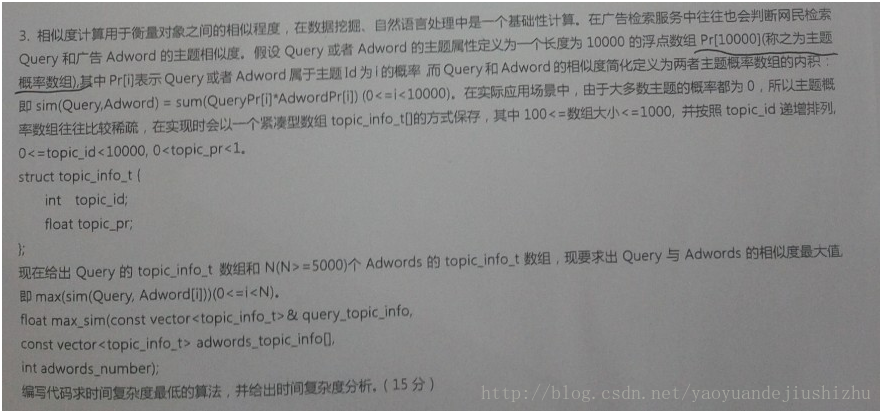
print('照片数据形状(维度): ', digits.data.shape)
print('标签数据形状(维度): ', digits.target.shape)
运行
照片数据形状(维度): (1797, 64)
标签数据形状(维度): (1797,)
1.2 打印照片和其标签
因为数据的维度是1797条,一共有64个维度。那么每一条数据是一个列表。但是我们知道图片是二维结构,而且我们知道digits数据集的图片是方形,所以我们要将图片原始数据重构(reshape)为(8,8)的数组。
为了让大家对于数据集有一个更直观的印象,我们在这里打印digits数据集的前5张照片。
#先查看图片是什么样子
print(digits.data[0])
#重构图片数据为(8,8)的数组
import numpy as np
print(np.reshape(digits.data[0], (8,8)))
运行
[ 0. 0. 5. 13. 9. 1. 0. 0. 0. 0. 13. 15. 10. 15. 5. 0. 0. 3.
15. 2. 0. 11. 8. 0. 0. 4. 12. 0. 0. 8. 8. 0. 0. 5. 8. 0.
0. 9. 8. 0. 0. 4. 11. 0. 1. 12. 7. 0. 0. 2. 14. 5. 10. 12.
0. 0. 0. 0. 6. 13. 10. 0. 0. 0.]
[[ 0. 0. 5. 13. 9. 1. 0. 0.]
[ 0. 0. 13. 15. 10. 15. 5. 0.]
[ 0. 3. 15. 2. 0. 11. 8. 0.]
[ 0. 4. 12. 0. 0. 8. 8. 0.]
[ 0. 5. 8. 0. 0. 9. 8. 0.]
[ 0. 4. 11. 0. 1. 12. 7. 0.]
[ 0. 2. 14. 5. 10. 12. 0. 0.]
[ 0. 0. 6. 13. 10. 0. 0. 0.]]
在notebook中显示matplotlib的图片
%matplotlib inline
import numpy as np
import matplotlib.pyplot as plt
#选取数据集前5个数据
data = digits.data[0:5]
label = digits.target[0:5]
#画图尺寸宽20,高4
plt.figure(figsize = (20, 4))
for idx, (imagedata, label) in enumerate(zip(data, label)):
#画布被切分为一行5个子图。 idx+1表示第idx+1个图
plt.subplot(1, 5, idx+1)
image = np.reshape(imagedata, (8, 8))
#为了方便观看,我们将其灰度显示
plt.imshow(image, cmap = plt.cm.gray)
plt.title('The number of Image is {}'.format(label))
png
1.3 将数据分为训练集合测试集
为了减弱模型对数据的过拟合的可能性,增强模型的泛化能力。保证我们训练的模型可以对新数据进行预测,我们需要将digits数据集分为训练集和测试集。
from sklearn.model_selection import train_test_split
#测试集占总数据中的30%, 设置随机状态,方便后续复现本次的随机切分
X_train, X_test, y_train, y_test = train_test_split(digits.data, digits.target, test_size = 0.3, random_state=100)
1.4 训练、预测、准确率
在本文中,我们使用LogisticRegression。由于digits数据集合较小,我们就是用默认的solver即可
from sklearn.linear_model import LogisticRegression
logisticRegre = LogisticRegression()
#训练
logisticRegre.fit(X_train, y_train)
对新数据进行预测,注意如果只是对一个数据(一维数组)进行预测,一定要把该一维数组转化为矩阵形式。
data.reshape(n_rows, n_columns)
将data转化为维度为(n_rows, n_columns)的矩阵。注意,如果我们不知道要转化的矩阵的某一个维度的尺寸,可以将该值设为-1.
#测试集中的第一个数据。
#我们知道它是一行,但是如果不知道列是多少,那么设置为-1
#实际上,我们知道列是64
#所以下面的写法等同于X_test[0].reshape(1, 64)
one_new_image = X_test[0].reshape(1, -1)
#预测
logisticRegre.predict(one_new_image)
运行
array([9])
对多个数据进行预测
predictions = logisticRegre.predict(X_test[0:10])
#真实的数字
print(y_test[0:10])
#预测的数字
print(predictions)
#准确率
score = logisticRegre.score(X_test, y_test)
print(score)
运行结果
[9 9 0 2 4 5 7 4 7 2]
[9 3 0 2 4 5 7 4 3 2]
0.9592592592592593
哇,还是很准的啊
1.5 混淆矩阵
一般评价预测准确率经常会用到混淆矩阵(Confusion Matrix),这里我们使用seaborn和matplotlib绘制混淆矩阵。
% matplotlib inline
import matplotlib.pyplot as plt
import seaborn as sns
from sklearn.metrics import confusion_matrix
predictions = logisticRegre.predict(X_test)
cm = confusion_matrix(y_test, predictions)
plt.figure(figsize = (9, 9))
sns.heatmap(cm, annot=True, fmt='.3f', linewidth=0.5, square=True, cmap='Blues_r')
plt.ylabel('Actual Label')
plt.xlabel('Predicted Label')
plt.title('Accurate Score: {}'.format(score), size=15)
png
二、MNIST数据集
digits数据集特别的小,刚刚的训练和预测都只需几秒就可以搞定。但是如果数据集很大时,我们对于训练的速度的要求就变得紧迫起来,模型的参数调优就显得很有必要。所以,我们拿MNIST这个大数据集试试手。我从网上将mnist下载下来,整理为csv文件。其中第一列为标签,之后的列为图片像素点的值。共785列。MNIST数据集的图片是28*28组成的。
import pandas as pd
import numpy as np
train = pd.read_csv('mnist_train.csv', header = None)
test = pd.read_csv('mnist_test.csv', header = None)
y_train = train.loc[:, 0] #pd.series
#注意:train.loc[:, 1:]返回的是pd.DataFrame类。
#这里我们要将其转化为np.array方便操作
X_train = np.array(train.loc[:, 1:])
y_test = test.loc[:, 0]
X_test = np.array(test.loc[:, 1:])
#我们看看这些MNIST维度
print('X_train 维度: {}'.format(X_train.shape))
print('y_train 维度: {}'.format(y_train.shape))
print('X_test 维度: {}'.format(X_test.shape))
print('y_test 维度: {}'.format(y_test.shape))
运行结果
X_train 维度: (60000, 784)
y_train 维度: (60000,)
X_test 维度: (10000, 784)
y_test 维度: (10000,)
2.1 打印MNIST图片和标签
%matplotlib inline
import numpy as np
import matplotlib.pyplot as plt
#只看5张图片数据
data = X_train[0:5]
label = y_train[0:5]
plt.figure(figsize = (20, 4))
for idx, (imagedata, label) in enumerate(zip(data, label)):
plt.subplot(1, 5, idx+1)
#MNIST数据集的图片为28*28像素
image = np.reshape(imagedata, (28,28))
plt.imshow(image, cmap=plt.cm.gray)
plt.title('The number of Image is {}'.format(label))
png
2.2 训练、预测、准确率
之前digits数据集才1797个,而且每个图片的尺寸是(8,8)。但是MNIST数据集高达70000,每张图片的尺寸是(28,28)。所以如果不考虑参数合理选择,训练的速度会很慢。
from sklearn.linear_model import LogisticRegression
import time
def model(solver='liblinear'):
"""
改变LogisticRegression模型的solver参数,计算运行准确率及时间
"""
start = time.time()
logisticRegr = LogisticRegression(solver=solver)
logisticRegr.fit(X_train, y_train)
score = logisticRegr.score(X_test, y_test)
end = time.time()
print('准确率:{0}, 耗时: {1}'.format(score, int(end-start)))
return logisticRegr
model(solver='liblinear')
model(solver='lbfgs')
运行结果
准确率:0.9176, 耗时3840
准确率:0.9173, 耗时65
经过测试发现,在我的macbook air2015默认
solver='liblinear'训练时间3840秒。
solver='lbfgs'训练时间65秒。
solver从liblinear变为lbfgs,只牺牲了0.0003的准确率,速度却能提高了将近60倍。 在机器学习训练中,算法参数不同,训练速度差异很大,看看下面这个图。
2.3 打印预测错误的图片
digits数据集使用的混淆矩阵查看准确率,但不够直观。这里我们打印预测错误的图片
logistricRegr = model(solver='lbfgs')
predictions = logistricRegr.predict(X_test)
#预测分类错误图片的索引
misclassifiedIndexes = []
for idx,(label,predict) in enumerate(zip(y_test, predictions)):
if label != predict:
misclassifiedIndexes.append(idx)
print(misclassifiedIndexes)
准确率:0.9173, 耗时76
[8, 33, 38, 63, 66, 73, 119, 124, 149, 151, 153, 193, 211, 217, 218, 233, 241, 245, 247, 259, 282, 290, 307, 313, 318, 320,
........
857, 877, 881, 898, 924, 938, 939, 947, 16789808, 9811, 9832, 9835, 9839, 9840, 9855, 9858, 9867, 9874, 9883, 9888, 9892, 9893, 9901, 9905, 9916, 9925, 9926, 9941, 9943, 9944, 9959, 9970, 9975, 9980, 9982, 9986]
将错误图片打印出来
%matplotlib inline
import matplotlib.pyplot as plt
import numpy as np
plt.figure(figsize = (20, 4))
#打印前5个分类错误的图片
for plotidx, badidx in enumerate(misclassifiedIndexes[0:5]):
plt.subplot(1, 5, plotidx+1)
img = np.reshape(X_test[badidx], (28, 28))
plt.imshow(img)
predict_label = predictions[badidx]
true_label = y_test[badidx]
plt.title('Predicted: {0}, Actual: {1}'.format(predict_label, true_label))
现在我们看看digits数据集统计性信息
#一共有1797个数据和1797标签
print('照片数据形状(维度): ', digits.data.shape)
print('标签数据形状(维度): ', digits.target.shape)
运行
照片数据形状(维度): (1797, 64)
标签数据形状(维度): (1797,)
1.2 打印照片和其标签
因为数据的维度是1797条,一共有64个维度。那么每一条数据是一个列表。但是我们知道图片是二维结构,而且我们知道digits数据集的图片是方形,所以我们要将图片原始数据重构(reshape)为(8,8)的数组。
为了让大家对于数据集有一个更直观的印象,我们在这里打印digits数据集的前5张照片。
#先查看图片是什么样子
print(digits.data[0])
#重构图片数据为(8,8)的数组
import numpy as np
print(np.reshape(digits.data[0], (8,8)))
运行
[ 0. 0. 5. 13. 9. 1. 0. 0. 0. 0. 13. 15. 10. 15. 5. 0. 0. 3.
15. 2. 0. 11. 8. 0. 0. 4. 12. 0. 0. 8. 8. 0. 0. 5. 8. 0.
0. 9. 8. 0. 0. 4. 11. 0. 1. 12. 7. 0. 0. 2. 14. 5. 10. 12.
0. 0. 0. 0. 6. 13. 10. 0. 0. 0.]
[[ 0. 0. 5. 13. 9. 1. 0. 0.]
[ 0. 0. 13. 15. 10. 15. 5. 0.]
[ 0. 3. 15. 2. 0. 11. 8. 0.]
[ 0. 4. 12. 0. 0. 8. 8. 0.]
[ 0. 5. 8. 0. 0. 9. 8. 0.]
[ 0. 4. 11. 0. 1. 12. 7. 0.]
[ 0. 2. 14. 5. 10. 12. 0. 0.]
[ 0. 0. 6. 13. 10. 0. 0. 0.]]
在notebook中显示matplotlib的图片
%matplotlib inline
import numpy as np
import matplotlib.pyplot as plt
#选取数据集前5个数据
data = digits.data[0:5]
label = digits.target[0:5]
#画图尺寸宽20,高4
plt.figure(figsize = (20, 4))
for idx, (imagedata, label) in enumerate(zip(data, label)):
#画布被切分为一行5个子图。 idx+1表示第idx+1个图
plt.subplot(1, 5, idx+1)
image = np.reshape(imagedata, (8, 8))
#为了方便观看,我们将其灰度显示
plt.imshow(image, cmap = plt.cm.gray)
plt.title('The number of Image is {}'.format(label))
png
1.3 将数据分为训练集合测试集
为了减弱模型对数据的过拟合的可能性,增强模型的泛化能力。保证我们训练的模型可以对新数据进行预测,我们需要将digits数据集分为训练集和测试集。
from sklearn.model_selection import train_test_split
#测试集占总数据中的30%, 设置随机状态,方便后续复现本次的随机切分
X_train, X_test, y_train, y_test = train_test_split(digits.data, digits.target, test_size = 0.3, random_state=100)
1.4 训练、预测、准确率
在本文中,我们使用LogisticRegression。由于digits数据集合较小,我们就是用默认的solver即可
from sklearn.linear_model import LogisticRegression
logisticRegre = LogisticRegression()
#训练
logisticRegre.fit(X_train, y_train)
对新数据进行预测,注意如果只是对一个数据(一维数组)进行预测,一定要把该一维数组转化为矩阵形式。
data.reshape(n_rows, n_columns)
将data转化为维度为(n_rows, n_columns)的矩阵。注意,如果我们不知道要转化的矩阵的某一个维度的尺寸,可以将该值设为-1.
#测试集中的第一个数据。
#我们知道它是一行,但是如果不知道列是多少,那么设置为-1
#实际上,我们知道列是64
#所以下面的写法等同于X_test[0].reshape(1, 64)
one_new_image = X_test[0].reshape(1, -1)
#预测
logisticRegre.predict(one_new_image)
运行
array([9])
对多个数据进行预测
predictions = logisticRegre.predict(X_test[0:10])
#真实的数字
print(y_test[0:10])
#预测的数字
print(predictions)
#准确率
score = logisticRegre.score(X_test, y_test)
print(score)
运行结果
[9 9 0 2 4 5 7 4 7 2]
[9 3 0 2 4 5 7 4 3 2]
0.9592592592592593
哇,还是很准的啊
1.5 混淆矩阵
一般评价预测准确率经常会用到混淆矩阵(Confusion Matrix),这里我们使用seaborn和matplotlib绘制混淆矩阵。
% matplotlib inline
import matplotlib.pyplot as plt
import seaborn as sns
from sklearn.metrics import confusion_matrix
predictions = logisticRegre.predict(X_test)
cm = confusion_matrix(y_test, predictions)
plt.figure(figsize = (9, 9))
sns.heatmap(cm, annot=True, fmt='.3f', linewidth=0.5, square=True, cmap='Blues_r')
plt.ylabel('Actual Label')
plt.xlabel('Predicted Label')
plt.title('Accurate Score: {}'.format(score), size=15)
png
二、MNIST数据集
digits数据集特别的小,刚刚的训练和预测都只需几秒就可以搞定。但是如果数据集很大时,我们对于训练的速度的要求就变得紧迫起来,模型的参数调优就显得很有必要。所以,我们拿MNIST这个大数据集试试手。我从网上将mnist下载下来,整理为csv文件。其中第一列为标签,之后的列为图片像素点的值。共785列。MNIST数据集的图片是28*28组成的。
import pandas as pd
import numpy as np
train = pd.read_csv('mnist_train.csv', header = None)
test = pd.read_csv('mnist_test.csv', header = None)
y_train = train.loc[:, 0] #pd.series
#注意:train.loc[:, 1:]返回的是pd.DataFrame类。
#这里我们要将其转化为np.array方便操作
X_train = np.array(train.loc[:, 1:])
y_test = test.loc[:, 0]
X_test = np.array(test.loc[:, 1:])
#我们看看这些MNIST维度
print('X_train 维度: {}'.format(X_train.shape))
print('y_train 维度: {}'.format(y_train.shape))
print('X_test 维度: {}'.format(X_test.shape))
print('y_test 维度: {}'.format(y_test.shape))
运行结果
X_train 维度: (60000, 784)
y_train 维度: (60000,)
X_test 维度: (10000, 784)
y_test 维度: (10000,)
2.1 打印MNIST图片和标签
%matplotlib inline
import numpy as np
import matplotlib.pyplot as plt
#只看5张图片数据
data = X_train[0:5]
label = y_train[0:5]
plt.figure(figsize = (20, 4))
for idx, (imagedata, label) in enumerate(zip(data, label)):
plt.subplot(1, 5, idx+1)
#MNIST数据集的图片为28*28像素
image = np.reshape(imagedata, (28,28))
plt.imshow(image, cmap=plt.cm.gray)
plt.title('The number of Image is {}'.format(label))
png
2.2 训练、预测、准确率
之前digits数据集才1797个,而且每个图片的尺寸是(8,8)。但是MNIST数据集高达70000,每张图片的尺寸是(28,28)。所以如果不考虑参数合理选择,训练的速度会很慢。
from sklearn.linear_model import LogisticRegression
import time
def model(solver='liblinear'):
"""
改变LogisticRegression模型的solver参数,计算运行准确率及时间
"""
start = time.time()
logisticRegr = LogisticRegression(solver=solver)
logisticRegr.fit(X_train, y_train)
score = logisticRegr.score(X_test, y_test)
end = time.time()
print('准确率:{0}, 耗时: {1}'.format(score, int(end-start)))
return logisticRegr
model(solver='liblinear')
model(solver='lbfgs')
运行结果
准确率:0.9176, 耗时3840
准确率:0.9173, 耗时65
经过测试发现,在我的macbook air2015默认
solver='liblinear'训练时间3840秒。
solver='lbfgs'训练时间65秒。
solver从liblinear变为lbfgs,只牺牲了0.0003的准确率,速度却能提高了将近60倍。 在机器学习训练中,算法参数不同,训练速度差异很大,看看下面这个图。
2.3 打印预测错误的图片
digits数据集使用的混淆矩阵查看准确率,但不够直观。这里我们打印预测错误的图片
logistricRegr = model(solver='lbfgs')
predictions = logistricRegr.predict(X_test)
#预测分类错误图片的索引
misclassifiedIndexes = []
for idx,(label,predict) in enumerate(zip(y_test, predictions)):
if label != predict:
misclassifiedIndexes.append(idx)
print(misclassifiedIndexes)
准确率:0.9173, 耗时76
[8, 33, 38, 63, 66, 73, 119, 124, 149, 151, 153, 193, 211, 217, 218, 233, 241, 245, 247, 259, 282, 290, 307, 313, 318, 320,
........
857, 877, 881, 898, 924, 938, 939, 947, 16789808, 9811, 9832, 9835, 9839, 9840, 9855, 9858, 9867, 9874, 9883, 9888, 9892, 9893, 9901, 9905, 9916, 9925, 9926, 9941, 9943, 9944, 9959, 9970, 9975, 9980, 9982, 9986]
将错误图片打印出来
%matplotlib inline
import matplotlib.pyplot as plt
import numpy as np
plt.figure(figsize = (20, 4))
#打印前5个分类错误的图片
for plotidx, badidx in enumerate(misclassifiedIndexes[0:5]):
plt.subplot(1, 5, plotidx+1)
img = np.reshape(X_test[badidx], (28, 28))
plt.imshow(img)
predict_label = predictions[badidx]
true_label = y_test[badidx]
plt.title('Predicted: {0}, Actual: {1}'.format(predict_label, true_label))
代码就不分享了!
标签:
版权申明:本站文章部分自网络,如有侵权,请联系:west999com@outlook.com
特别注意:本站所有转载文章言论不代表本站观点,本站所提供的摄影照片,插画,设计作品,如需使用,请与原作者联系,版权归原作者所有


 京公网安备 11010802041100号 | 京ICP备19059560号-4 | PHP1.CN 第一PHP社区 版权所有