1. 安装 Prometheus
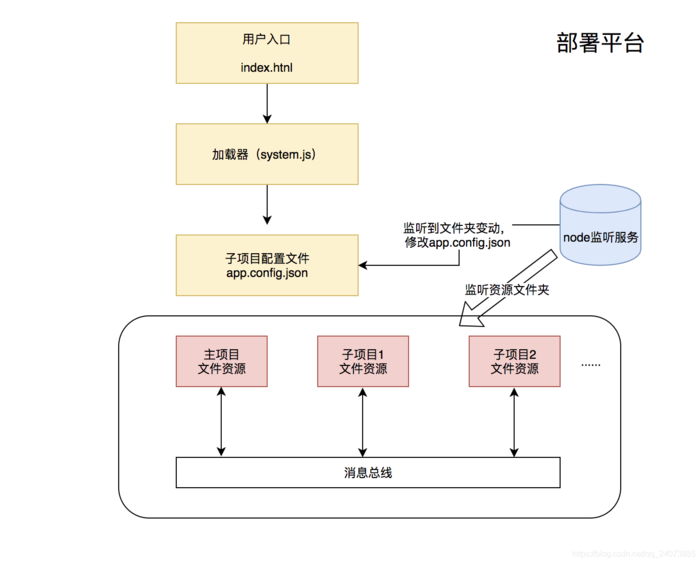
Prometheus 生态
由于原生 tsdb 性能的限制,经过性能测试选用 Clickhouse 作为第三方数据库,提升其大数据读写性能
1)下载并解压
wget https://github.com/prometheus/prometheus/releases/download/v2.3.2/prometheus-2.3.2.linux-amd64.tar.gz
tar -xvf prometheus-2.3.2.linux-amd64.tar.gz
2)进入并执行
cd  prometheus-2.3.2.linux-amd64
./ prometheus (调试时使用)
 nohup ./prometheus --config.file=prometheus.yml & (正常运行时使用)
3)安装 node_exporter
 wget https://github.com/prometheus/node_exporter/releases/download/v0.16.0-rc.3/node_exporter-0.16.0-rc.3.linux-amd64.tar.gz
 tar xzf node_exporter-0.16.0-rc.3.linux-amd64.tar.gz
4)进入并运行
 cd node_exporter-0.16.0-rc.3.linux-amd64
 ./node_exporter (调试时使用)
nohup ./node_exporter > out.log & (正常运行时使用)
5)配置Prometheus文件
添加如下到 prometheus.yml
 # The job name is added as a label `job=` to any timeseries scraped from this config.
 - job_name: 'node_exporter'
 # metrics_path defaults to '/metrics'
 # scheme defaults to 'http'.
 static_configs:
 - targets: ['localhost:9100']
( localhost 请自行根据上报服务器填写ip)
6)重启 Prometheus 获得数据,UI页面为 ip:9090 端口
2. 安装 Clickhouse
关于Clickhouse请参考 pigness.com.cn 的 clickhouse 安装
更详细的参考资料: ClickHouse集群搭建从0到1
3. 安装 prom2Click (在此感谢军哥对于此部分的指导)
1)github 位置 https://github.com/iyacontrol/prom2click
具体步骤请参考 prom2click 的 Readme文档
2)在 prometheus.yml 添加第三方读写功能
 remote_write:
 - url: "http://localhost:9201/write"
remote_read:
 - url: "http://localhost:9201/read"
3)重启 Prometheus 让配置生效
注:当遇到 golang.org/x 中 文件无法下载的情况时,请参考 https://studygolang.com/articles/10797
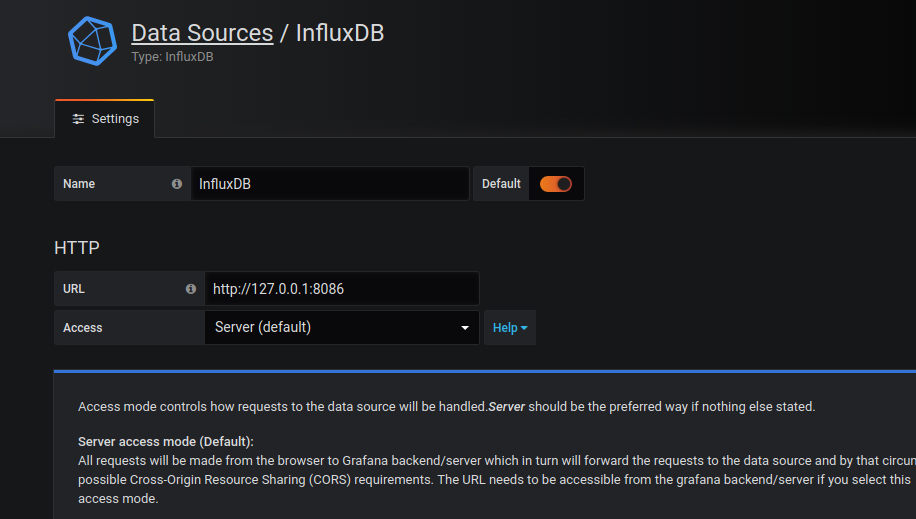
4. 安装 Grafana
Grafana官网(https://grafana.com/),上面有各个系统安装的步骤,我的mac是直接通过brew安装的(如果你的brew太慢,可以换成国内的源试一下)。安装后用brew services start grafana启动即可。启动后,即可通过http://127.0.0.1:3000/来访问了(默认账号密码是admin/admin)。进来之后应该看到这个页面:
更详细的可参考: https://blog.csdn.net/hfut_wowo/article/details/78536022
5. 安装 DataSource Plugin
sudo grafana-cli plugins install vertamedia-clickhouse-datasource
重启 Grafana 使其生效
至此,Prometheus + Clickhouse + Grafana 架构安装已全部完成


![[ipsec][strongswan]strongswan源码分析(五)plugin的配置文件的添加方法与管理架构解析](https://img2.php1.cn/3cdc5/3909/339/3e35aa3d77315ada.png)


 京公网安备 11010802041100号