作者:fanhua1 | 来源:互联网 | 2023-09-24 19:53
MongoDBCharts安装和使用-MongoDBCharts安装和使用最近发现了个有意思的东西,MongoDBCharts,它是MongoDB官方提供的用于图表展示MongoD
MongoDB Charts 安装和使用
最近发现了个有意思的东西,MongoDB Charts ,它是MongoDB官方提供的 用于图表展示MongoDB数据的
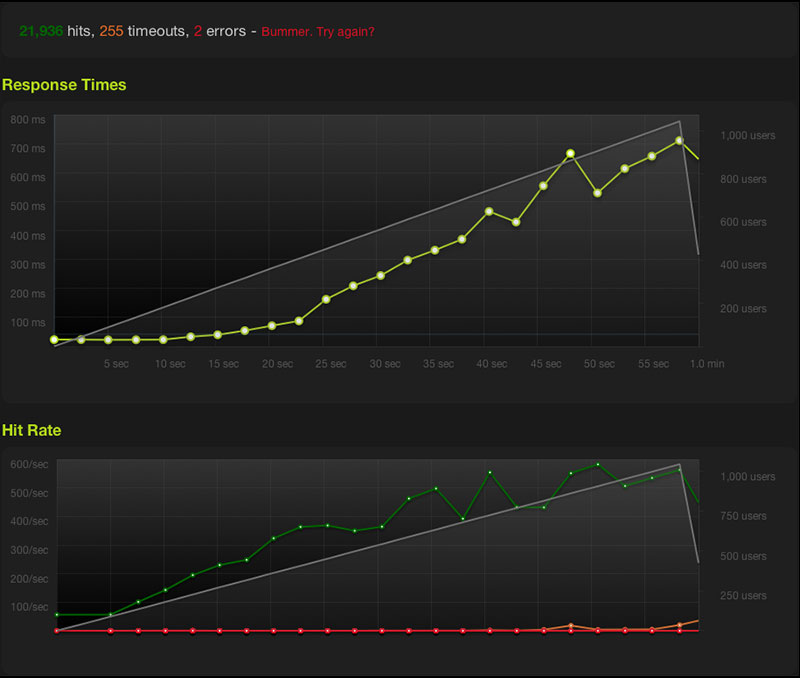
效果图:
1.什么是MongoDB Charts
MongoDB Charts最强大的功能之一是其内置的 聚合功能。聚合允许您通过各种指标处理收集数据,并执行平均值和标准差等计算,以进一步了解您的数据。
并且它提供了Embed Chart 功能 方便嵌入到你自己Web程序中
2.安装和运行MongoDB Charts
安装过程步骤挺多的,但是对着官方教程一步步来 还是很简单的
官方MongoDB Charts 安装文档

2.1 准备环境
- Mac/Linux 系统
- Docker version 18.09.1
- MongoDB shell version v4.2.0
由于MongoDB Charts需要使用Docker安装,所以需要有Dokcer环境
2.2 创建一个目录存储图表配置
mkdir mongodb-charts
cd mongodb-charts
2.3 下载MongoDB Charts Docker Compose file
https://www.mongodb.com/downl...
Dokcer Compose file

附上我下载的文件
version: '3.3'

services:
  charts:
    image: quay.io/mongodb/charts:19.12.1
    hostname: charts
    ports:
      # host:container port mapping. If you want MongoDB Charts to be
      # reachable on a different port on the docker host, change this
      # to :80, e.g. 8888:80.
      - 80:80
      - 443:443
    volumes:
      - keys:/mongodb-charts/volumes/keys
      - logs:/mongodb-charts/volumes/logs
      - db-certs:/mongodb-charts/volumes/db-certs
      - web-certs:/mongodb-charts/volumes/web-certs
    environment:
      # The presence of following 2 environment variables will enable HTTPS on Charts server.
      # All HTTP requests will be redirected to HTTPS as well.
      # To enable HTTPS, upload your certificate and key file to the web-certs volume,
      # uncomment the following lines and replace with the names of your certificate and key file.
      # CHARTS_HTTPS_CERTIFICATE_FILE: charts-https.crt
      # CHARTS_HTTPS_CERTIFICATE_KEY_FILE: charts-https.key

      # This environment variable controls the built-in support widget and
      # metrics collection in MongoDB Charts. To disable both, set the value
      # to "off". The default is "on".
      CHARTS_SUPPORT_WIDGET_AND_METRICS: 'on'
      # Directory where you can upload SSL certificates (.pem format) which
      # should be considered trusted self-signed or root certificates when
      # Charts is accessing MongoDB servers with ?ssl=true
      SSL_CERT_DIR: /mongodb-charts/volumes/db-certs
    networks:
      - backend
    secrets:
      - charts-mongodb-uri

networks:
  backend:

volumes:
  keys:
  logs:
  db-certs:
  web-certs:

secrets:
  charts-mongodb-uri:
    external: true
2.4 Enable Docker Swarm mode
docker swarm init
2.5 拉取MongoDB Charts image 镜像
对应你下载的 Docker Compose file 版本
docker pull quay.io/mongodb/charts:19.12.1
2.6 测试连接到 MongoDB 数据库
官方示例
docker run --rm quay.io/mongodb/charts:19.12.1 charts-cli test-connection 'mongodb://:@host.docker.internal'
我的mongo在本地 注意这里不能使用 localhost,要使用 host.dokcer.internal
docker run --rm quay.io/mongodb/charts:19.12.1 charts-cli test-connection 'mongodb://host.docker.internal'
正确案例:

错误案例:

2.7 创建一个Docker secret 为MongoDB Charts
官方案例:
echo "" | docker secret create charts-mongodb-uri -
我的输入:
echo "mongodb://host.docker,internal" | docker secret create charts-mongodb-uri -

2.8 运行MongoDB Charts 容器
docker stack deploy -c charts-docker-swarm-19.12.1.yml mongodb-charts
2.9 查看运行状态
docker service ls
2.10 创建 MongoDB Charts 访问 Users账号
MAC/Linux 官方案例:
docker exec -it \
  $(docker container ls --filter name=_charts -q) \
  charts-cli add-user --first-name "" --last-name "" \
  --email "" --password "" \
  --role ""
Windows 官方案例
docker exec -it `
  $(docker container ls --filter name=_charts -q) `
  charts-cli add-user --first-name "" --last-name "" `
  --email "" --password "" `
  --role ""
就是输入 登录的账号 密码 以及权限等

如果输入错误 会有提示 而且很详细
2.11 直接访问 Compose file 里配置的端口
默认 - 80:80 端口
直接访问 localhost:80
至此 MongoDB Charts 已经安装并且成功运行了,下面开始讲解 如何使用 MongoDB Charts 去创建图表等
3. MongoDB Charts 使用
3.1 首先先关联一个 MongoDB 数据源
注意:地址 mongodb://host.docker.internal 不是 mongodb://localhost:27017


3.2 选择一个MongoDB数据库

3.3 在Dashboard 一栏New Dashboard
输入 Title 和 描述


3.4 新增一个Chart
3.4.1 选择一个Collections

3.4.2 选择Chart Type
就是你要的图表类型

3.4.3 需求: 根据订单状态 去统计图表
拖拽你要分组得 字段 并且按id 进行count计算
并且可以添加过滤条件 以及一些自定义的设置(如 图表里显示的label)

4. Embed Chart 导出你的图表 嵌入到自己的Web环境
4.1 保存你设置好的图表后
选择Embed Chart
4.2 开启匿名访问图表 并且复制 Embed Code
可以看到它会提供一段代码,只要复制这段代码到自己的环境中去即可

4.3 创建HTML 文件
Mongodb-Charts
5. 总结
本篇主要讲解 MongoDB Charts 的安装以及如何运行它 ,并且简单介绍了一下 如何使用 MongoDB Charts 去绘制一个图表,最后讲解了 如何导出你的图表并且嵌入到自己的HTML 页面中去 , 对着官方文档一步步来就可以了 还是很简单的 加油吧!


 京公网安备 11010802041100号