作者:慕容盼烟迎曼 | 来源:互联网 | 2023-01-10 15:42
安装配置Grafana参考https:testerhome.comarticles23629使用配置下载jmx_exporterhttps:github.comprometheus
安装配置Grafana参考
https://testerhome.com/articles/23629
使用配置
- 下载jmx_exporter
https://github.com/prometheus/jmx_exporter
- 创建jmx_exporter配置文件
vim simple-config.yml
lowercaseOutputLabelNames: true
lowercaseOutputName: true
whitelistObjectNames: ["java.lang:type=OperatingSystem"]
blacklistObjectNames: []
rules:
  - pattern: ‘java.lang<>(committed_virtual_memory|free_physical_memory|free_swap_space|total_physical_memory|total_swap_space)_size:‘
    name: os_$1_bytes
    type: GAUGE
    attrNameSnakeCase: true
  - pattern: ‘java.lang<>((?!process_cpu_time)\w+):‘
    name: os_$1
    type: GAUGE
    attrNameSnakeCase: true
- 在prometheus配置文件中添加配置
scrape_configs:
  - job_name: ‘java‘
    static_configs:
    - targets: [‘:‘]
- 重启prometheus
nohup ./prometheus > prometheus.log 2>&1 &
- 下载并导入dashboards
https://grafana.com/grafana/dashboards/7727
https://grafana.com/grafana/dashboards/8563
注:8563模板对7727有依赖,所以需全部安装,否则不能正常使用
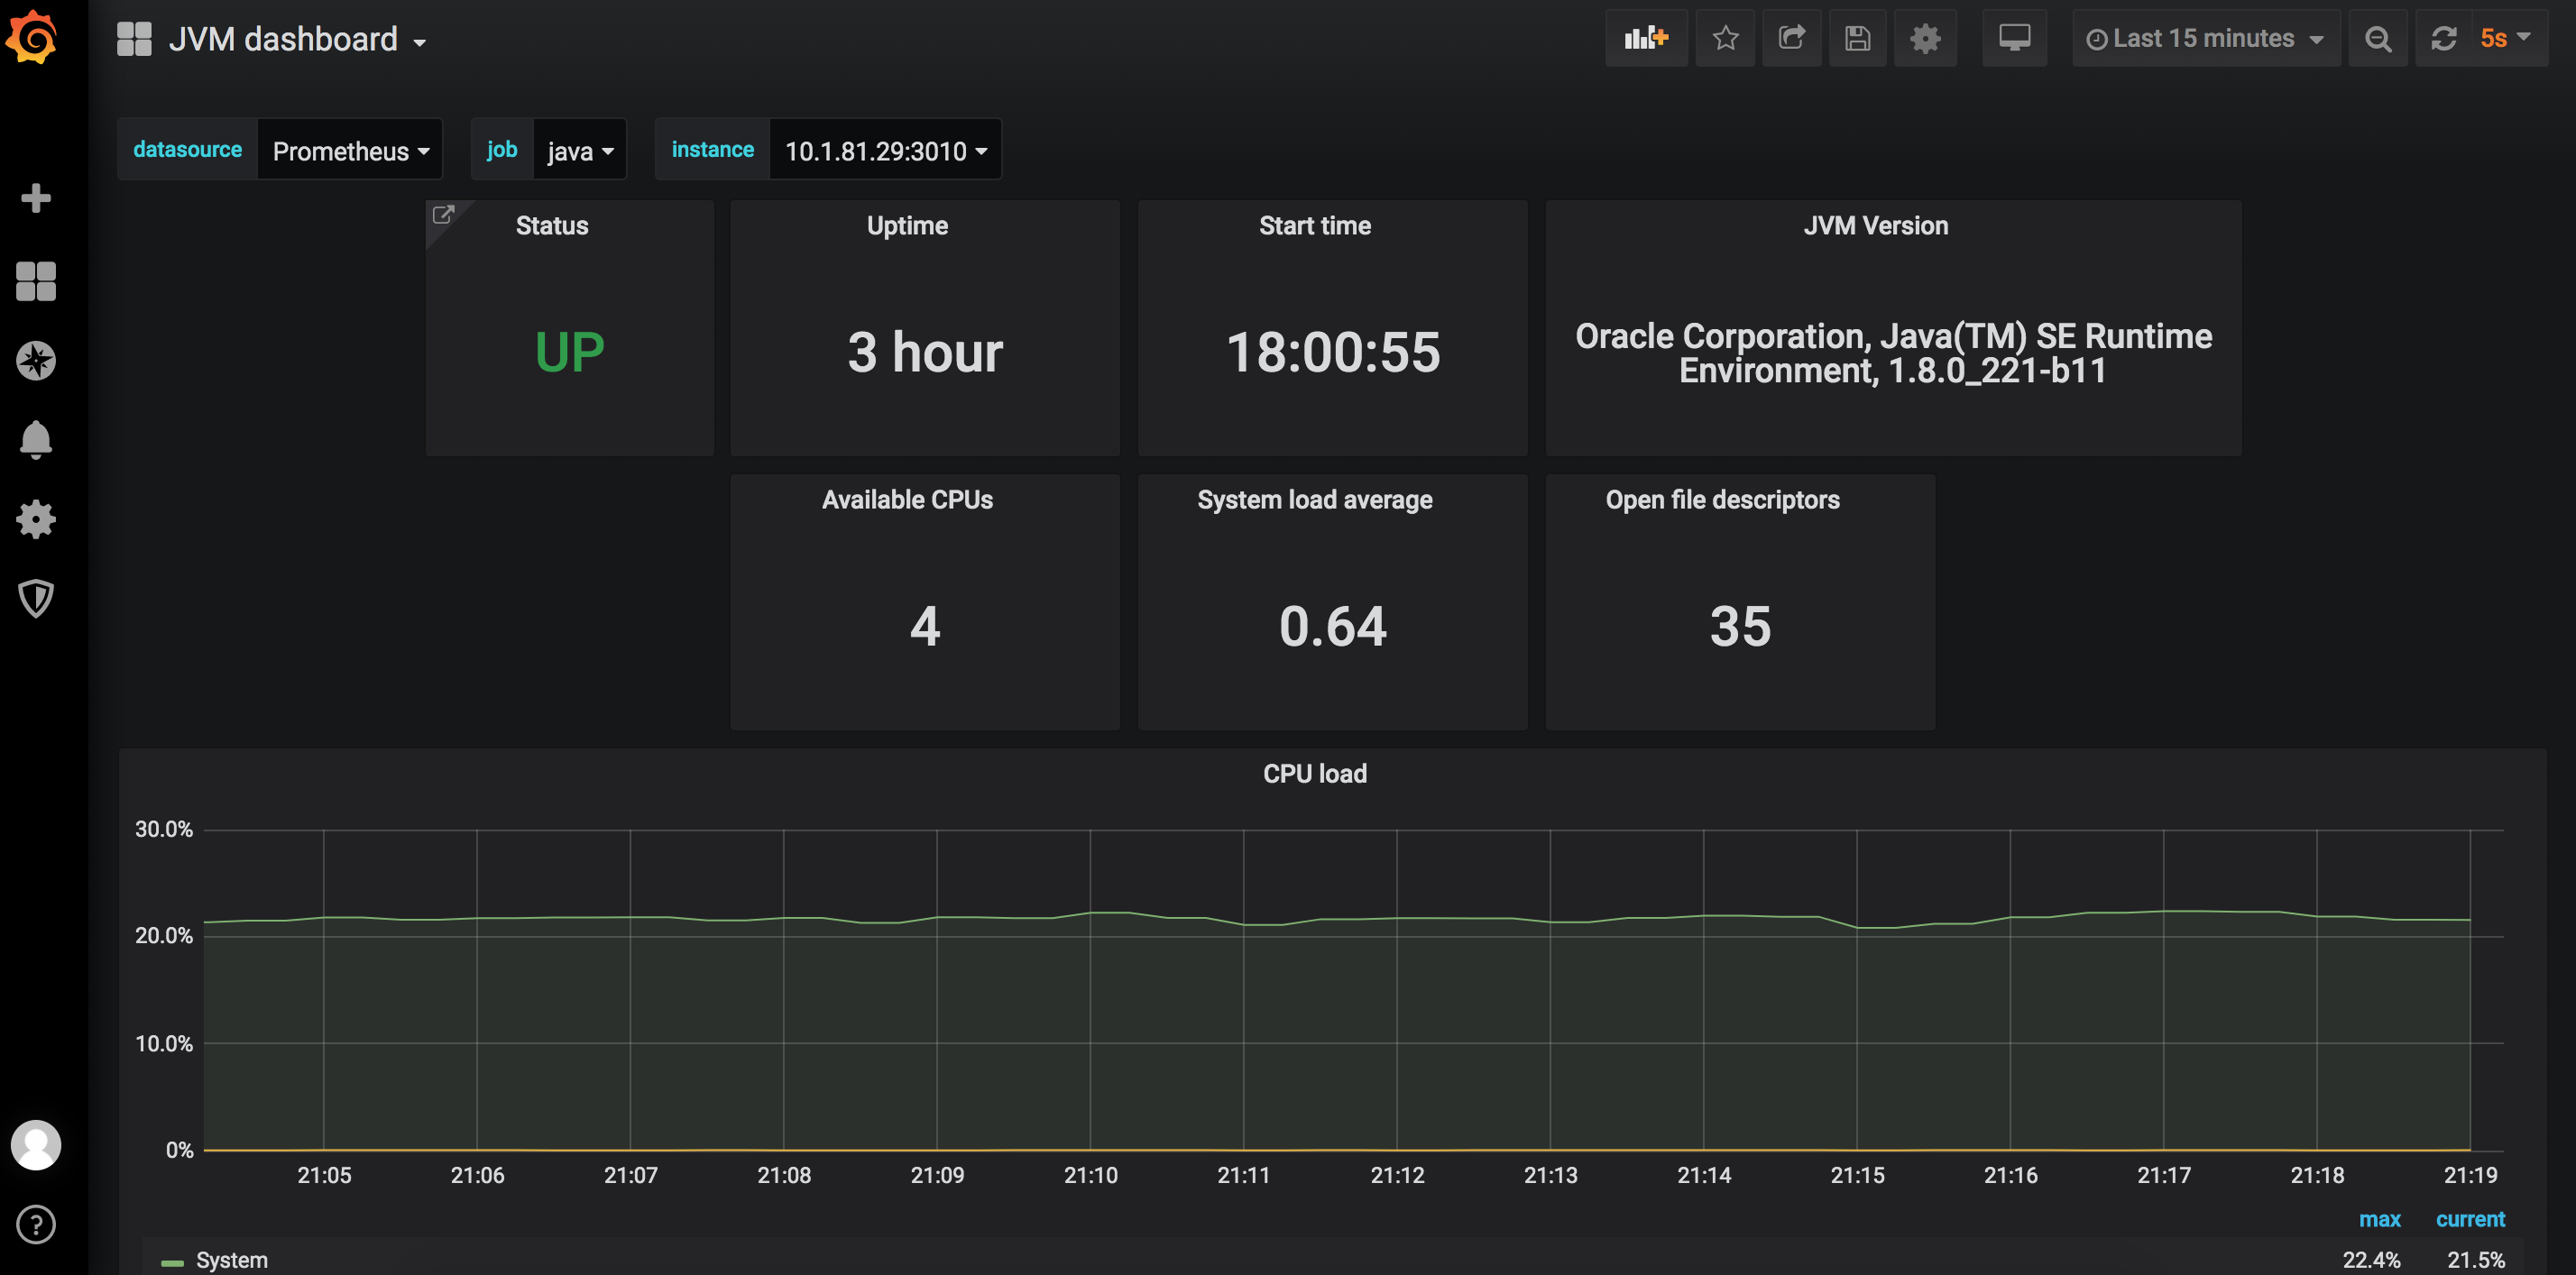
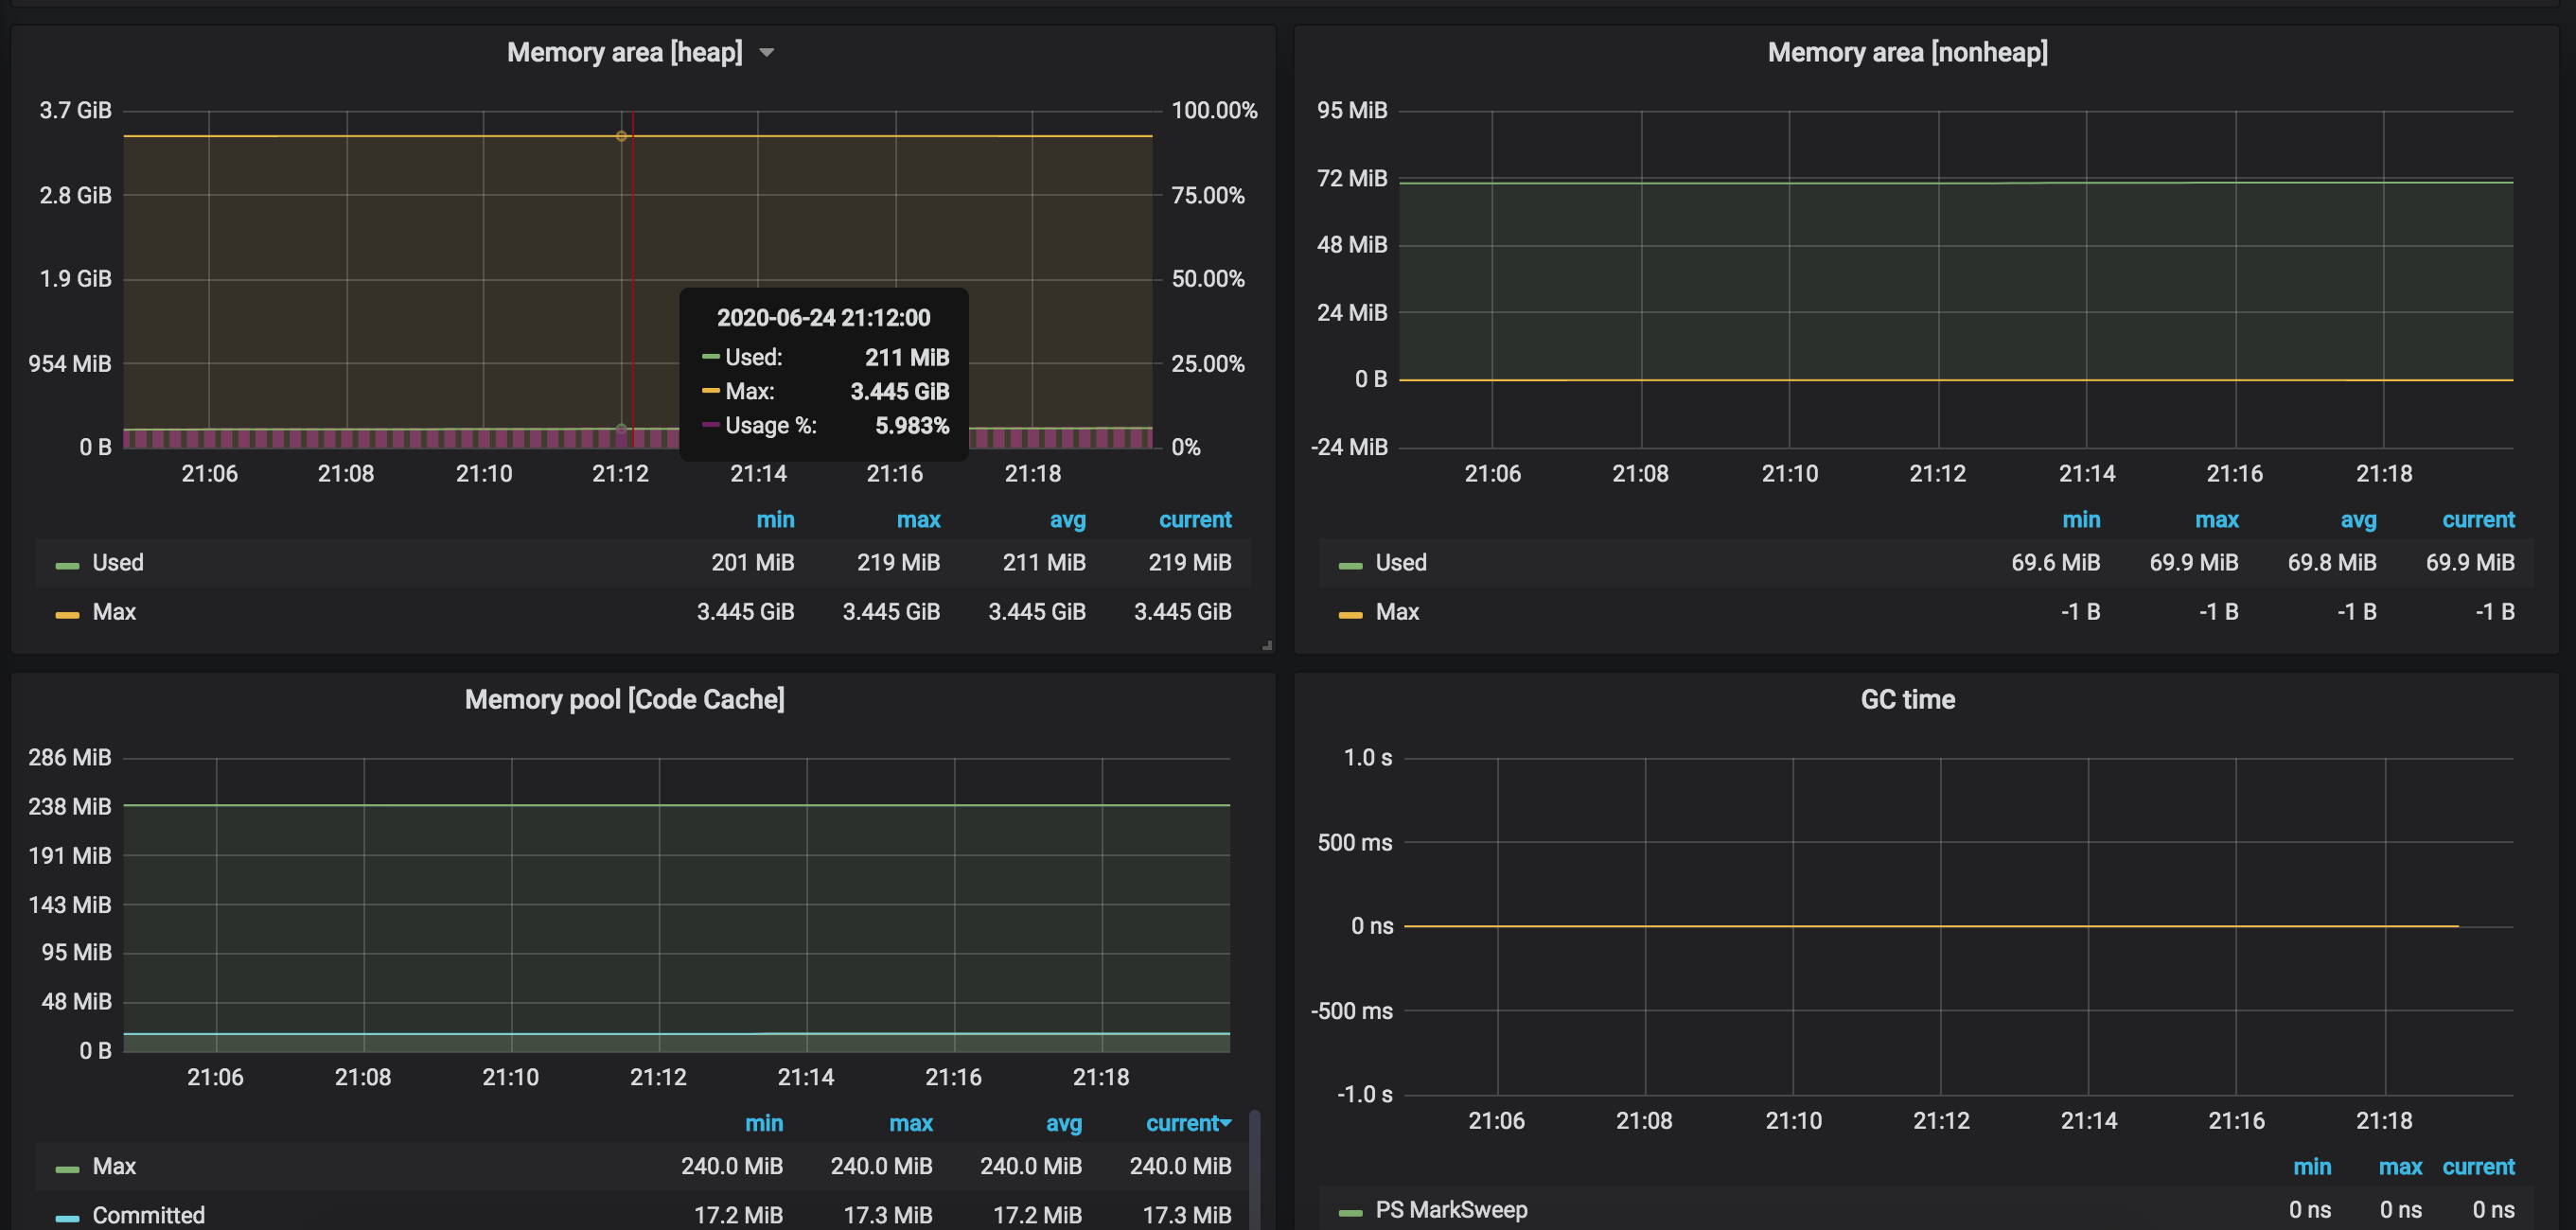
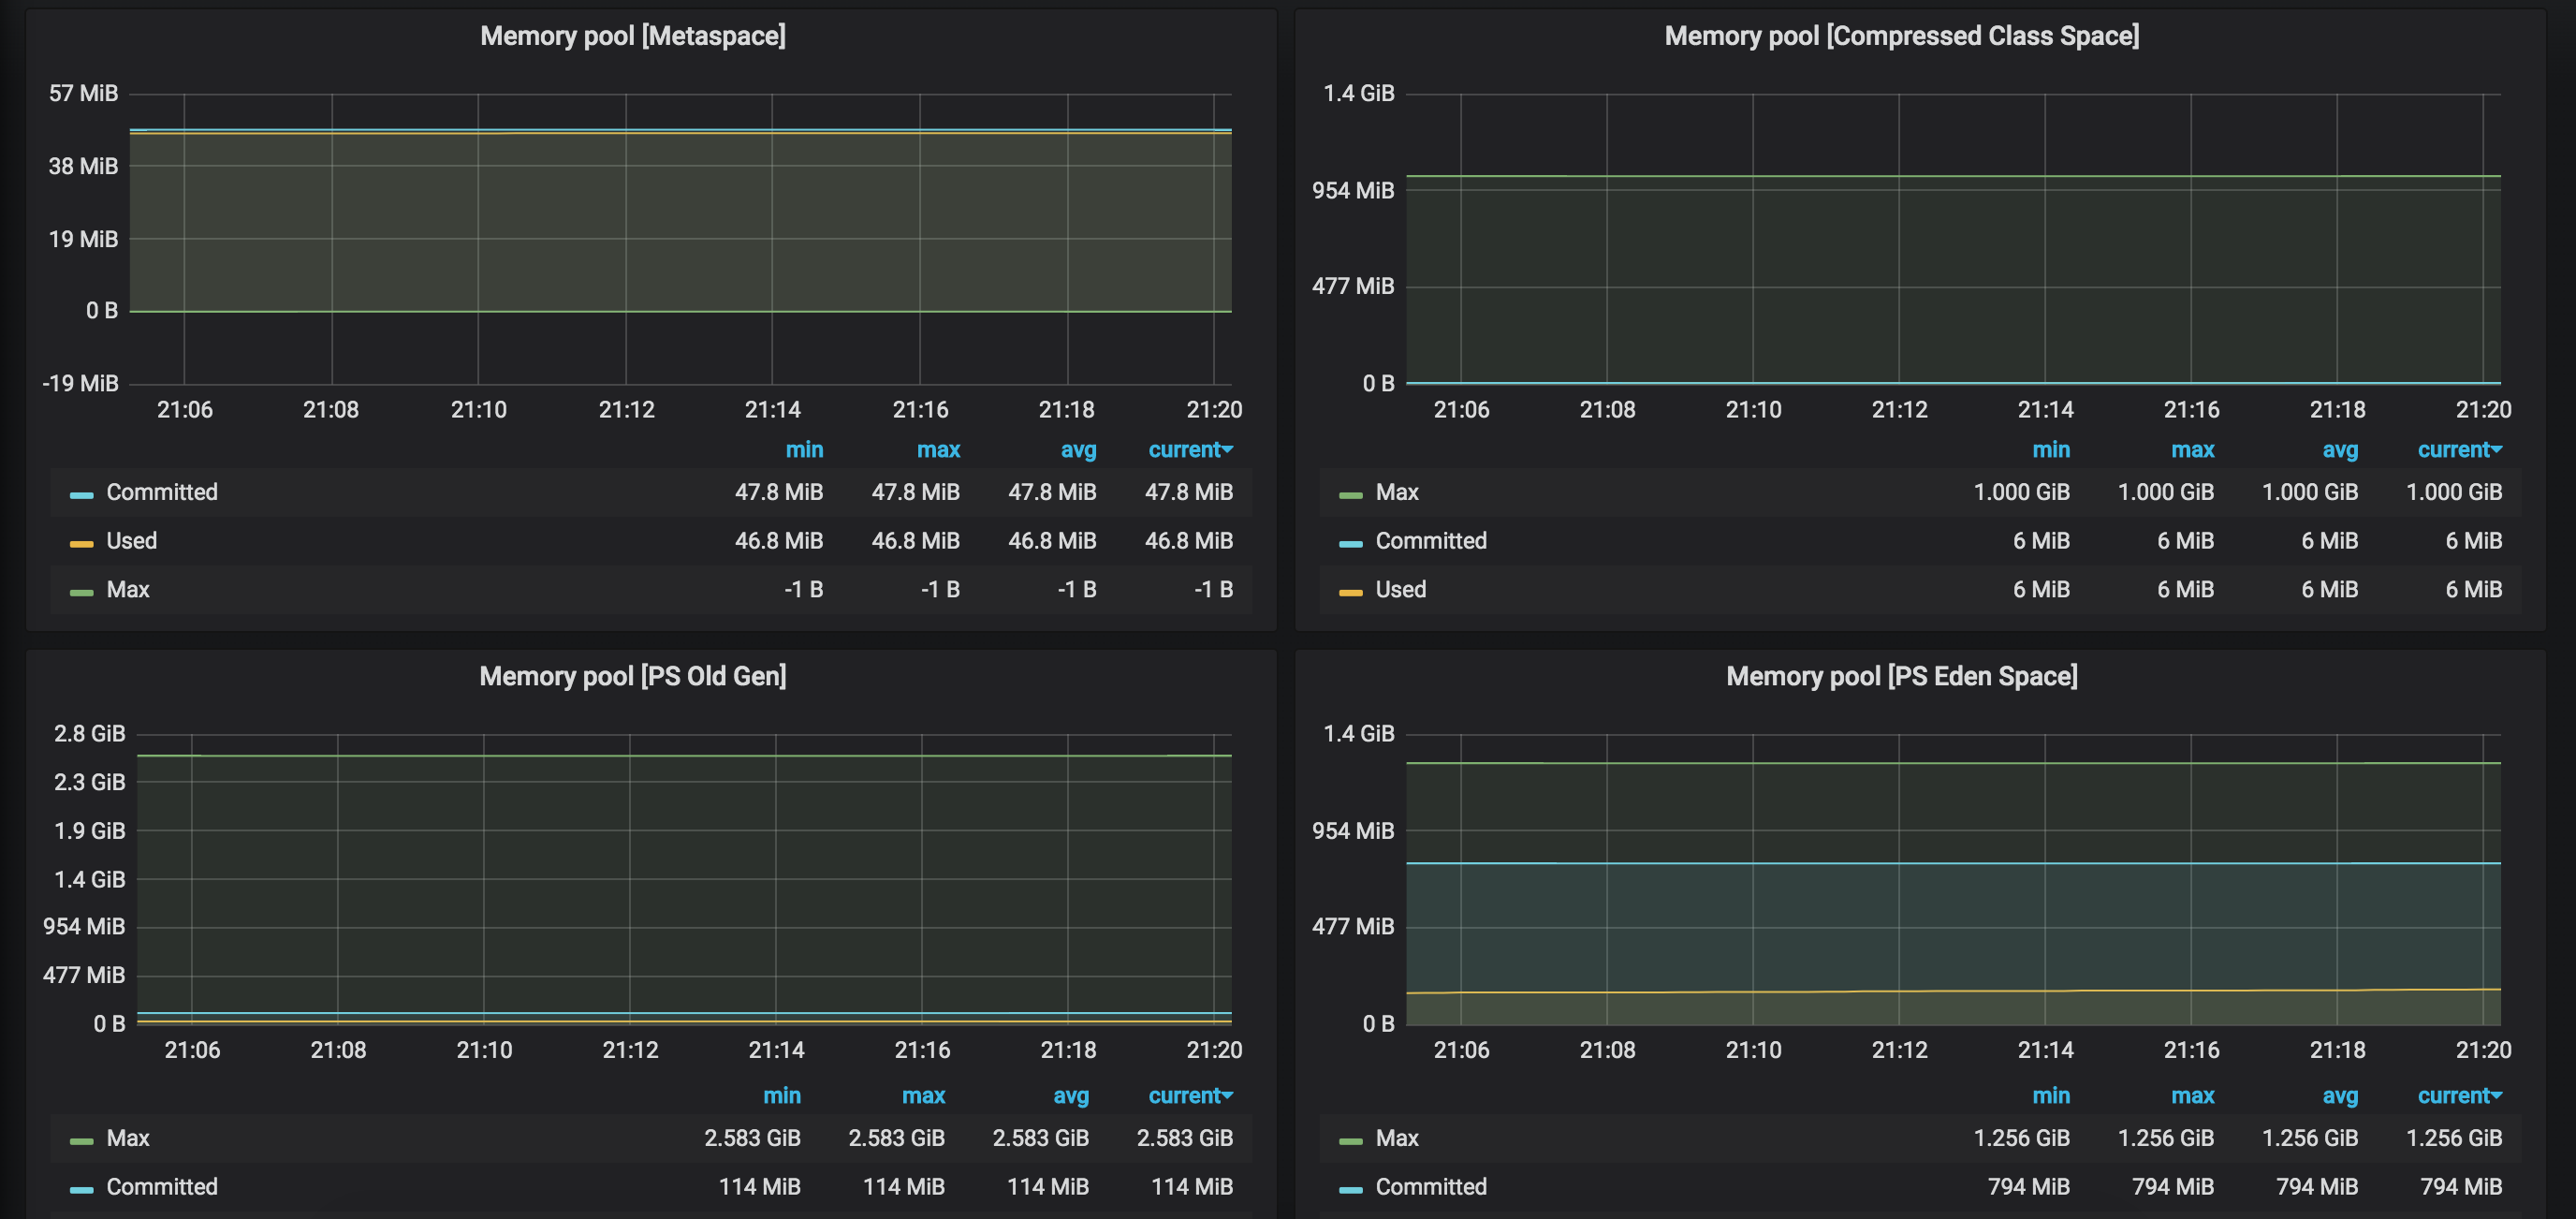
效果图
扫一扫,关注我

Grafana监控JVM


 京公网安备 11010802041100号