作者:二比大哥大 | 来源:互联网 | 2023-09-17 18:25
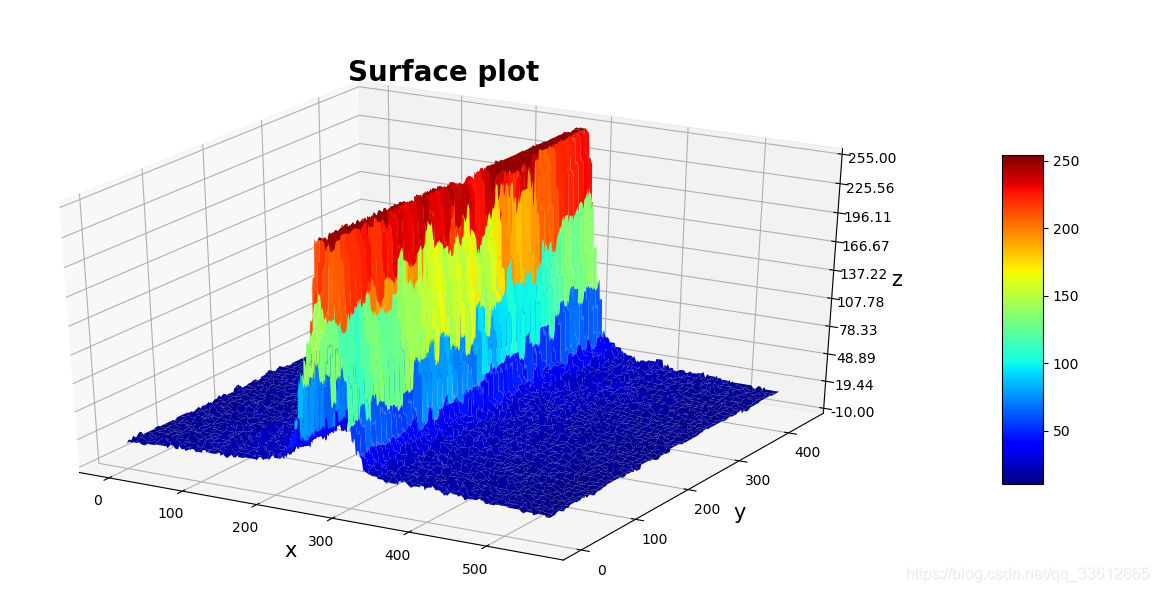
1 绘制思路
(1)彩色图片转化为灰度图片;
(2)灰度图片装换为矩阵;
(3)matplot将矩阵在三维空间中绘制出来;
(4)x:图片宽度;y:图片高度;z:灰度值
2绘制代码
import numpy as np
import cv2 as cv
import matplotlib.pyplot as plt
from mpl_toolkits.mplot3d import Axes3D
from matplotlib import cm
from matplotlib.ticker import LinearLocator, FormatStrFormatter
fig = plt.figure(figsize=(16,12))
ax = fig.gca(projection="3d")
img = cv.imread("01.jpg")
img = cv.cvtColor(img,cv.COLOR_BGR2GRAY)
imgd = np.array(img)
sp = img.shape
h = int(sp[0])
w = int(sp[1])
x = np.arange(0,w,1)
y = np.arange(0,h,1)
x,y = np.meshgrid(x,y)
z = imgd
surf = ax.plot_surface(x, y, z, cmap=cm.jet)
ax.set_zlim(-10, 255)
ax.zaxis.set_major_locator(LinearLocator(10))
ax.zaxis.set_major_formatter(FormatStrFormatter('%.02f'))
ax.set_xlabel('x', size=15)
ax.set_ylabel('y', size=15)
ax.set_zlabel('z', size=15)
ax.set_title("Surface plot", weight='bold', size=20)
fig.colorbar(surf, shrink=0.6, aspect=8)
plt.show()
**
3 colormap 设置
**
colormap参考网址:https://blog.csdn.net/Mr_Cat123/article/details/78638491
本文参考参考网址:https://blog.csdn.net/yefcion/article/details/80883605
**
4 效果图展示
**
