作者:cc_lzx_530 | 来源:互联网 | 2023-02-10 20:29
文章目录 seaborn库 matplotlib库 pydotplus
seaborn库 是一个基于matplotlib的可视化库
1、将矩阵绘制成混淆矩阵(热点图):
import matplotlib. pyplot as pltimport seaborn. heatmap( mat) . show( )
示例:绘制一个二分类的混淆矩阵:
import matplotlib. pyplot as pltimport seabornimport numpyimport randomfrom sklearn. metrics import confusion_matrixtest = [ ] = [ ] for i in range ( 1000 ) : test. append( random. randint( 0 , 1 ) ) predict. append( random. randint( 0 , 1 ) ) = confusion_matrix( test, predict) . heatmap( mat) . show( )
效果:
2、seaborn可以导入数据集(需要联网)
详细:https://blog.csdn.net/weixin_41571493/article/details/82528742?utm_source=blogxgwz3
import seaborn= seaborn. load_dataset( 'iris' ) print ( iris)
效果:
sepal_length sepal_width petal_length petal_width species0 5.1 3.5 1.4 0.2 setosa1 4.9 3.0 1.4 0.2 setosa2 4.7 3.2 1.3 0.2 setosa3 4.6 3.1 1.5 0.2 setosa4 5.0 3.6 1.4 0.2 setosa. . . . . . . . . . . . . . . . . 145 6.7 3.0 5.2 2.3 virginica146 6.3 2.5 5.0 1.9 virginica147 6.5 3.0 5.2 2.0 virginica148 6.2 3.4 5.4 2.3 virginica149 5.9 3.0 5.1 1.8 virginica[ 150 rows x 5 columns]
3、利用导入的数据库获取各样本数目和描述性统计指标
import seabornseaborn_iris = seaborn. load_dataset( 'iris' ) print ( seaborn_iris. groupby( 'species' ) . size( ) ) print ( seaborn_iris. describe( ) )
各类别的数目:
species50 50 50 : int64
描述性统计指标:
sepal_length sepal_width petal_length petal_width150.000000 150.000000 150.000000 150.000000 5.843333 3.057333 3.758000 1.199333 0.828066 0.435866 1.765298 0.762238 min 4.300000 2.000000 1.000000 0.100000 25 % 5.100000 2.800000 1.600000 0.300000 50 % 5.800000 3.000000 4.350000 1.300000 75 % 6.400000 3.300000 5.100000 1.800000 max 7.900000 4.400000 6.900000 2.500000
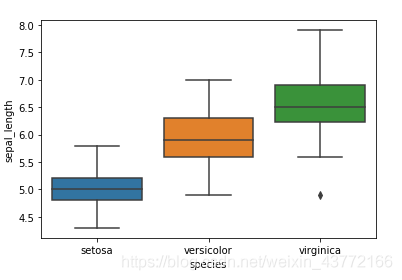
4、利用导入的数据集,绘制箱形图
seaborn.boxplot(x = , y = ):规定x轴和y轴
import matplotlib. pyplot as pltimport seaborniris = seaborn. load_dataset( 'iris' ) seaborn. boxplot( x = iris[ "species" ] , y = iris[ "sepal_length" ] ) . show( ) . boxplot( x = iris[ "species" ] , y = iris[ "sepal_width" ] ) . show( ) . boxplot( x = iris[ "species" ] , y = iris[ "petal_length" ] ) . show( ) . boxplot( x = iris[ "species" ] , y = iris[ "petal_width" ] ) . show( )
效果:
matplotlib库 1、matplotlib.pyplot.show():
将绘制的图形显示出来,否则图形会在最后显示
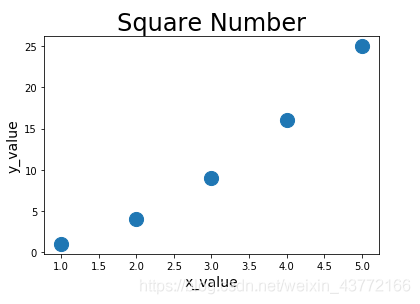
2、绘制散点图
scatter(x = ,y = ,s = ):散点图
绘制一个平方散点图
import matplotlib. pyplot as pltx_value = [ 1 , 2 , 3 , 4 , 5 ] = [ 1 , 4 , 9 , 16 , 25 ] plt. title( 'Square Number' , fontsize = 24 ) . xlabel( 'x_value' , fontsize = 14 ) . ylabel( 'y_value' , fontsize = 14 ) . scatter( x = x_value, y = y_value, s = 200 ) . show( )
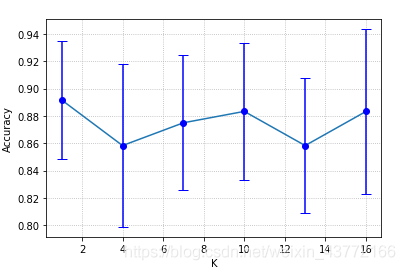
效果:3、添加误差线
plt.errorbar(K[i], acc[i], fmt=“bo:”, yerr = std[i], capsize = 5)
1)前两个参数表示横坐标和纵坐标
2)fmt表示颜色
3)yerr表示y轴上误差线的长度,相应的也有xerr
4)capsize表示误差线边界横线的长度
详细说明:https://www.jianshu.com/p/5973680a1542
示例:给对应的点添加标准差
for i in range ( len ( K) ) : plt. errorbar( K[ i] , acc[ i] , fmt= "bo:" , yerr = std[ i] , capsize = 5 ) . plot( K, acc) . grid( linestyle= ':' ) . xlabel( 'K' ) . ylabel( 'Accuracy' ) . show( )
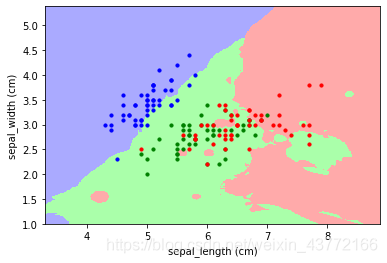
效果:4、生成空间分类图
我知道的两种绘图方式:pcolormesh、scatter
前者的运行速度比后者要快很多
下面代码只是绘图的部分,如果运行并不能实现下图的效果
from matplotlib. colors import ListedColormapimport matplotlib. pyplot as plt= ListedColormap( [ '#AAAAFF' , '#AAFFAA' , '#FFAAAA' ] ) = [ 'blue' , 'green' , 'red' ] . pcolormesh( X, Y, Z, cmap = color_map) for i in range ( len ( iris. data) ) : plt. scatter( iris. data[ i] [ 0 ] , iris. data[ i] [ 1 ] , c = color[ y[ i] ] , s = 10 ) . show( )
效果:
pydotplus 基于鸢尾花数据集生成决策树的可视化
详细说明:https://blog.csdn.net/luanpeng825485697/article/details/78965390
from sklearn. externals. six import StringIOimport pydotplusfrom sklearn import treeimport os. environ[ "PATH" ] += os. pathsep + 'C:/Program Files (x86)/Graphviz2.38/bin/' def visual ( index) : dot_data = StringIO( ) target_name = [ 'setosa' , 'versicolor' , 'virginica' ] attr_names = [ 'sepal_length (cm)' , 'sepal_width (cm)' ] tree. export_graphviz( clf, out_file= dot_data, feature_names= attr_names, class_names= target_name, filled= True , rounded= True , special_characters= True ) graph = pydotplus. graph_from_dot_data( dot_data. getvalue( ) ) pic_name = 'tree' + str ( index) + '.png' graph. write_png( pic_name)


 京公网安备 11010802041100号