作者:道义信_686 | 来源:互联网 | 2023-09-06 08:21
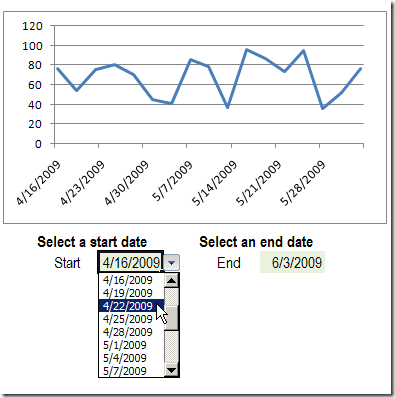
excel图表配合下拉菜单Insteadofshowingallthedatainachart,youcanselectaspecificdaterange,andshowonly
excel图表配合下拉菜单
Instead of showing all the data in a chart, you can select a specific date range, and show only the data from that period. In this example, drop down lists of dates are created with data validation. Select Excel chart dates from a drop down list, and the chart changes to show the new range.
您可以选择一个特定的日期范围,而仅显示该期间的数据,而不是在图表中显示所有数据。 在此示例中,日期下拉列表是通过数据验证创建的。 从下拉列表中选择Excel图表日期,图表将更改以显示新范围。
To create this dynamic chart in Excel 2007, you can create a table from the chart data, then create named ranges, and use those names in the chart.
若要在Excel 2007中创建此动态图表,可以从图表数据中创建一个表,然后创建命名范围,并在图表中使用这些名称。
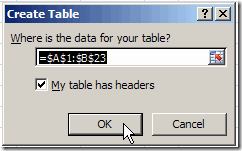
为图表数据创建Excel表 (Create an Excel Table for the Chart Data)
[Note: Please see the post, Problems With Dynamic Charts in Excel and ignore this step — the Excel Table may cause problems.]
[ 注意 :请参阅“ Excel中的动态图表问题”一文,而忽略此步骤-Excel表可能会引起问题。]
- On the Chart sheet, select a cell in the chart data, e.g. cell A1
在图表工作表上,在图表数据中选择一个单元格,例如单元格A1
- On the Ribbon, click the Insert tab, then click Table
在功能区上,单击“插入”选项卡,然后单击“表”。
- In the Create Table dialog box, click OK, to create the table for the selected range.
在“创建表”对话框中,单击“确定”,以为所选范围创建表。
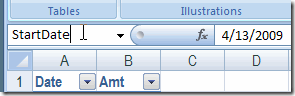
命名开始日期和结束日期单元格 (Name the Start Date and End Date cells)
- On the Chart sheet, select the Start Date cell (F17)
在图表工作表上,选择开始日期单元格(F17)
- In the Name box, type StartDate then press Enter, to name the cell
在“名称”框中,键入StartDate,然后按Enter,以命名该单元格
- Select the End Date cell I17, and in the Name Box type EndDate, then press Enter
选择“结束日期”单元格I17,然后在“名称框”中键入EndDate,然后按Enter。
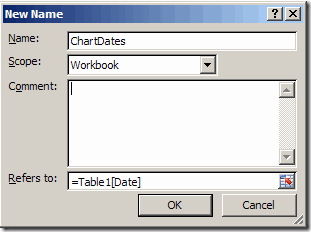
命名图表日期范围 (Name the Chart Date Range)
[Note: Because you did not create an Excel Table, as advised above, use the following formula in step 3, to create a dynamic range for the ChartDates: =OFFSET(Chart!$A$1,1,0,COUNT(Chart!$A:$A),1)
[ 注意 :因为没有按照上面的建议创建Excel表,所以在步骤3中使用以下公式为ChartDates创建动态范围:= OFFSET(Chart!$ A $ 1,1,0,COUNT(Chart! $ A:$ A),1)
- On the Ribbon, click the Formulas tab, then click Define Name
在功能区上,单击“公式”选项卡,然后单击“定义名称”
- Type ChartDates as the name for the range
键入ChartDates作为范围的名称
Click in the Refers To box, and select the Chart Dates (A2:A23) on the worksheet.
单击“引用到”框,然后在工作表上选择“图表日期”(A2:A23)。
Because this range is in an Excel Table, the reference will automatically change to show the
由于此范围位于Excel表中,因此引用将自动更改为显示
table name and column name, Table1[Date]
表名和列名,Table1 [Date]
- Click OK
点击确定
创建开始日期和结束日期下拉菜单 (Create the Start Date and End Date dropdowns)
- On the Chart sheet, select the Start Date cell (F17)
在图表工作表上,选择开始日期单元格(F17)
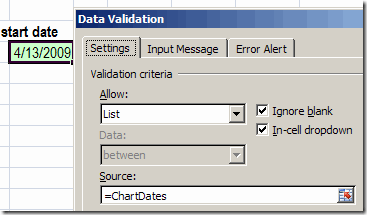
- On the Ribbon, click the Data tab, then click Data Validation
在功能区上,单击“数据”选项卡,然后单击“数据验证”
- From the Allow dropdown, select List
从“允许”下拉列表中,选择“列表”
- In the Formula box type: =ChartDates
在“公式”框中,键入:= ChartDates
- Click OK, then repeat these steps to create a dropdown for the End Date.
单击“确定”,然后重复这些步骤以创建“结束日期”下拉列表。
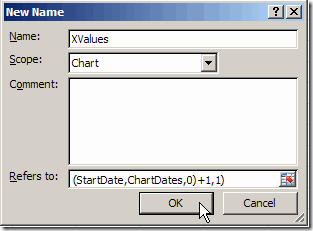
定义X和Y值的命名范围: (Define the named ranges for X and Y values:)
- On the Ribbon, click the Formulas tab, then click Define Name
在功能区上,单击“公式”选项卡,然后单击“定义名称”
- Type a name for the series: XValues
键入系列的名称:XValues
- From the Scope dropdown, select the data sheet name, Chart
从范围下拉列表中,选择数据表名称,图表
Type a formula that finds the start and end dates in the data:
输入一个可在数据中找到开始和结束日期的公式:
=OFFSET(Chart!$A$2,MATCH(StartDate,ChartDates,0)-1,0,
= OFFSET(图表!$ A $ 2,MATCH(StartDate,ChartDates,0)-1,0,
MATCH(EndDate,ChartDates,0)-
MATCH(EndDate,ChartDates,0)-
MATCH(StartDate,ChartDates,0)+1,1)
匹配(StartDate,ChartDates,0)+1,1)
- Click OK
点击确定
Follow the same steps to define the YValues named range, using the following Settings:
使用以下设置,按照相同的步骤定义YValues命名范围:
Name: Yvalues
名称:Yvalues
Scope: Chart
范围:图表
Refers To: =OFFSET(Chart!XValues,0,1)
引用:= OFFSET(Chart!XValues,0,1)
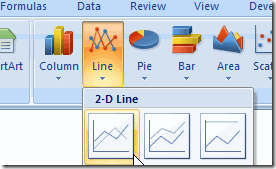
创建图表 (Create the chart)
- Select a cell in the chart data
在图表数据中选择一个单元格
- On the Ribbon, click Insert, then click Line in the Charts group
在功能区上,单击“插入”,然后在“图表”组中单击“折线”
- Click the first Line chart option
单击第一个折线图选项
- To hide the Legend, click the Ribbon’s Layout tab, click Legend, and click None
若要隐藏图例,请单击功能区的“布局”选项卡,单击“图例”,然后单击“无”。
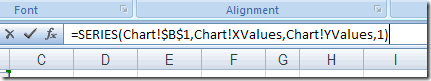
使图表动态 (Make the chart dynamic)
- Select the chart, and click the line to select it
选择图表,然后单击线以将其选中
In the formula bar, change the series formula, replacing cell references with range names:
在公式栏中,更改系列公式,将单元格引用替换为范围名称:
=SERIES(Chart!$B$1,Chart!XValues,Chart!YValues,1)
= SERIES(图表!$ B $ 1,图表!XValues,图表!YValues,1)
测试图表 (Test the chart)
- Select a start and end date from the drop down lists, and the chart will display that range
从下拉列表中选择开始和结束日期,图表将显示该范围
Warning: If you select the entire range, the series formula will revert to absolute cell references instead of the named ranges. (This doesn’t happen in earlier versions of Excel.)
警告 :如果选择整个范围,则序列公式将恢复为绝对单元格引用,而不是命名范围。 (在早期版本的Excel中不会发生这种情况。)
下载样本文件 (Download the Sample File)
You can download the completed Excel 2007 sample file for Dynamic Date Range Charts.
您可以为动态日期范围图表下载完整的Excel 2007示例文件。
[Note: Please see the post, Problems With Dynamic Charts in Excel and download that sample file — the Excel Table may cause problems.] _________________
[ 注意 :请参阅帖子“ Excel中的动态图表问题”并下载该示例文件-Excel表可能会引起问题。] _________________
翻译自: https://contexturesblog.com/archives/2009/05/03/select-excel-chart-dates-from-a-drop-down-list/
excel图表配合下拉菜单


 京公网安备 11010802041100号