我正在根据获得的一些历史GPS项圈数据制作动画,显示狼的去向。该代码基于以下Mapbox示例:https://docs.mapbox.com/mapbox-gl-js/example/live-update-feature/
我想根据白天还是晚上来给线段上色,晚上是蓝色,白天是红色。像这样:
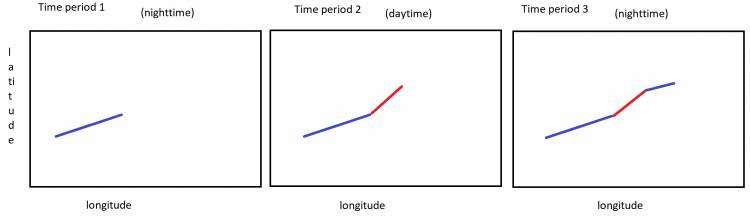
在时间段1中,狼向东向东北移动;现在是晚上,所以线段是蓝色的。在时间段2中,狼向东北移动;现在是白天,因此线段为红色。在时间段3,狼再次向东北移动。现在是晚上,所以线段再次变成蓝色。
但是我似乎无法使用其他颜色。我有一些玩具/示例数据:
 "type": "FeatureCollection", "features": [  "type": "Feature", "geometry":
"type": "LineString", "coordinates" : [[-112.191833, 57.073668],
[-112.181833, 57.083668],
[-112.181833, 57.073668],
[-112.201833, 57.075668]]  ],
"properties": "daytime" : [0, 1, 1, 0]
有四个时间段,中间两个是白天(设置为1)。
这是我的代码。 (您需要将其粘贴到mapbox键中才能起作用):
mapboxgl.accessToken = 'INSERT YOUR MAPBOX KEY HERE';
var map = new mapboxgl.Map(
	container: 'map',
	style: 'mapbox://styles/mapbox/satellite-v9',
	zoom: 0
);
map.on('load', function()
	// We use D3 to fetch the JSON here to parse and use it separately
	// from GL JS's use in the added source. You can use any request method
	// that you want.
	d3.json(
		"https://raw.githubusercontent.com/pete-rodrigue/wolves_of_alberta/data_store/wolves_geojson_example.geojson?token=ACEMB42EH5NKZSF24MHPQSS6JFTMU",
		function(err, data)
			if (err) throw err;

			// save full coordinate list for later
			var coordinates = data.features[0].geometry.coordinates;
			// save 1's and 0's for later
			var daynight = data.properties.daytime

			// start by showing just the first coordinate
			data.features[0].geometry.coordinates = [coordinates[0]];
			// THIS NEXT LINE IS ONE PART OF MY FAILED APPROACH:
			data.properties.daytime = ['blue'];   //  set initial color value to blue

			// add it to the map
			map.addSource('trace',  type: 'geojson', data: data );
			map.addLayer(
				'id': 'trace',
				'type': 'line',
				'source': 'trace',
				'paint':
					// THIS WILL WORK FINE
					'line-color': 'orange',
					// 'line-color': ['to-string', ['get', 'daytime']], //  DOES NOT WORK
					'line-width': 8
				,
				layout: 'line-cap': 'round', 'line-join': 'round'
			);

			// setup the viewport
			map.jumpTo( 'center': coordinates[0], 'zoom': 13 );
			map.setPitch(30);

			// on a regular basis, add more coords from the saved list to update map
			var i = 0;
			var timer = window.setInterval(function()
				if (i 					data.features[0].geometry.coordinates.push(
						coordinates[i]
					);

					// if it's daytime, append blue; if it's nighttime, append red
					if (daynight[i] == 0)
						data.properties.daytime.push(['blue']);
					 else data.properties.daytime.push(['red']);

				map.getSource('trace').setData(data);
				map.panTo(coordinates[i]);
				i++;
			 else
				window.clearInterval(timer);

		, 150);

);
);
body  margin: 0; padding: 0;
#map  position: absolute; top: 0; bottom: 0; width: 100%;
也在这里:https://codepen.io/pete-rodrigue/pen/XWbJOpK
我已经注释掉了无效的部分,并留下了注释。
基本上,我正在尝试这样做:
'line-color': ['to-string', ['get', 'daytime']]
在paint的map.addLayer()部分中,其中daytime属性是一个字符串数组,该字符串表示为“ blue”或“ red”,随着动画的进行,我将新元素压入其中-这就是代码:
if (daynight[i] == 0)
   data.properties.daytime.push(['blue']);  // if it's daytime, append blue
  else
   data.properties.daytime.push(['red']);  // if it's nighttime, append red
我肯定有一个显而易见的原因为什么这不起作用。但是我对此并不陌生。
非常感谢您对基本原理的任何帮助和解释。


 京公网安备 11010802041100号