作者:mobiledu2502874377 | 来源:互联网 | 2023-09-08 13:53
在 实时动态曲线 一节介绍了使用算法实现实时动态曲线,Qt提供了charts模块,使用QSplineSeries就能很轻松的实现平滑曲线了,而且效果很好,但是需要注意一点的是,免费
在 实时动态曲线 一节介绍了使用算法实现实时动态曲线,Qt 提供了 charts 模块,使用 QSplineSeries 就能很轻松的实现平滑曲线了,而且效果很好,但是需要注意一点的是,免费版的 Qt 中 charts 模块是 GPL 协议的。
效果如下,随着时间变化,曲线会从右向左移动
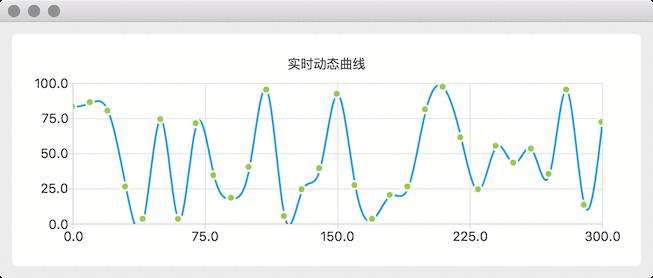
如果不会使用 QChart,可以先参考 使用 QChart 创建平滑曲线 后在看下面的实现代码。核心算法就是收到一个新的数据时添加到 List 的后面,并把 List 的第一个数据删除,看上去就是曲线向前滑动了一步。
1
2
3
4
5
6
7
8
9
10
11
12
13
14
15
16
17
18
19
20
21
22
23
24
25
26
27
28
29
30
31
32
33
34
35
36
37
38
39
40
41
42
|
#ifndef REALTIMECURVEQCHARTWIDGET_H
#define REALTIMECURVEQCHARTWIDGET_H
#include
#include
#include
#include
#include
#include
using
namespace QtCharts;
class RealTimeCurveQChartWidget :
public QWidget {
Q_OBJECT
public:
explicit RealTimeCurveQChartWidget(QWidget *parent = 0);
~RealTimeCurveQChartWidget();
protected:
void timerEvent(QTimerEvent *event) Q_DECL_OVERRIDE;
private:
/**
* 接收到数据源发送来的数据,数据源可以下位机,采集卡,传感器等。
*/
void dataReceived(int value);
int timerId;
int maxSize;
// data 最多存储 maxSize 个元素
int maxX;
int maxY;
QList<
double> data;
// 存储业务数据的 list
QChart *chart;
QChartView *chartView;
QSplineSeries *splineSeries;
QScatterSeries *scatterSeries;
};
#endif // REALTIMECURVEQCHARTWIDGET_H
|
1
2
3
4
5
6
7
8
9
10
11
12
13
14
15
16
17
18
19
20
21
22
23
24
25
26
27
28
29
30
31
32
33
34
35
36
37
38
39
40
41
42
43
44
45
46
47
48
49
50
51
52
53
54
55
56
57
58
59
60
61
62
63
64
65
66
|
#include "RealTimeCurveQChartWidget.h"
#include
#include
RealTimeCurveQChartWidget::RealTimeCurveQChartWidget(QWidget *parent) : QWidget(parent) {
maxSize =
31;
// 只存储最新的 31 个数据
maxX =
300;
maxY =
100;
splineSeries =
new QSplineSeries();
scatterSeries =
new QScatterSeries();
scatterSeries->setMarkerSize(
8);
chart =
new QChart();
chart->addSeries(splineSeries);
chart->addSeries(scatterSeries);
chart->legend()->hide();
chart->setTitle(
"实时动态曲线");
chart->createDefaultAxes();
chart->axisX()->setRange(
0,
300);
chart->axisY()->setRange(
0, maxY);
chartView =
new QChartView(chart);
chartView->setRenderHint(QPainter::Antialiasing);
QHBoxLayout *layout =
new QHBoxLayout();
layout->setContentsMargins(
0,
0,
0,
0);
layout->addWidget(chartView);
setLayout(layout);
timerId = startTimer(
200);
qsrand(QDateTime::currentDateTime().toTime_t());
}
RealTimeCurveQChartWidget::~RealTimeCurveQChartWidget() {
}
void RealTimeCurveQChartWidget::timerEvent(QTimerEvent *event) {
// 产生一个数据,模拟不停的接收到新数据
if (event->timerId() == timerId) {
int newData = qrand() % (maxY +
1);
dataReceived(newData);
}
}
void RealTimeCurveQChartWidget::dataReceived(
int value) {
data <
// 数据个数超过了最大数量,则删除最先接收到的数据,实现曲线向前移动
while (data.size() > maxSize) {
data.removeFirst();
}
// 界面被隐藏后就没有必要绘制数据的曲线了
if (isVisible()) {
splineSeries->clear();
scatterSeries->clear();
int dx = maxX / (maxSize
-1);
int less = maxSize - data.size();
for (
int i =
0; i
splineSeries->append(less*dx+i*dx, data.at(i));
scatterSeries->append(less*dx+i*dx, data.at(i));
}
}
}
|
1
2
3
4
5
6
7
8
9
10
11
12
|
#include "RealTimeCurveQChartWidget.h"
#include
int main(int argc, char *argv[]) {
QApplication a(argc, argv);
RealTimeCurveQChartWidget w;
w.resize(
700,
400);
w.show();
return a.exec();
}
|

![[二分图]JZOJ 4612 游戏](https://img.php1.cn/3cd4a/1eebe/cd5/2fdc212433a29829.png)


 京公网安备 11010802041100号